RE/MAX balloon logo

RE/MAX Innovative Properties
2 Ash Street
Hollis, NH 03049

Karen R. Brown

Karen R. Brown
Licensed in MA & NH

c: 603.321.7513 | o: 603.465.8800

Facebook logo Instagram logo LinkedIn logo

July Essex County Housing Report

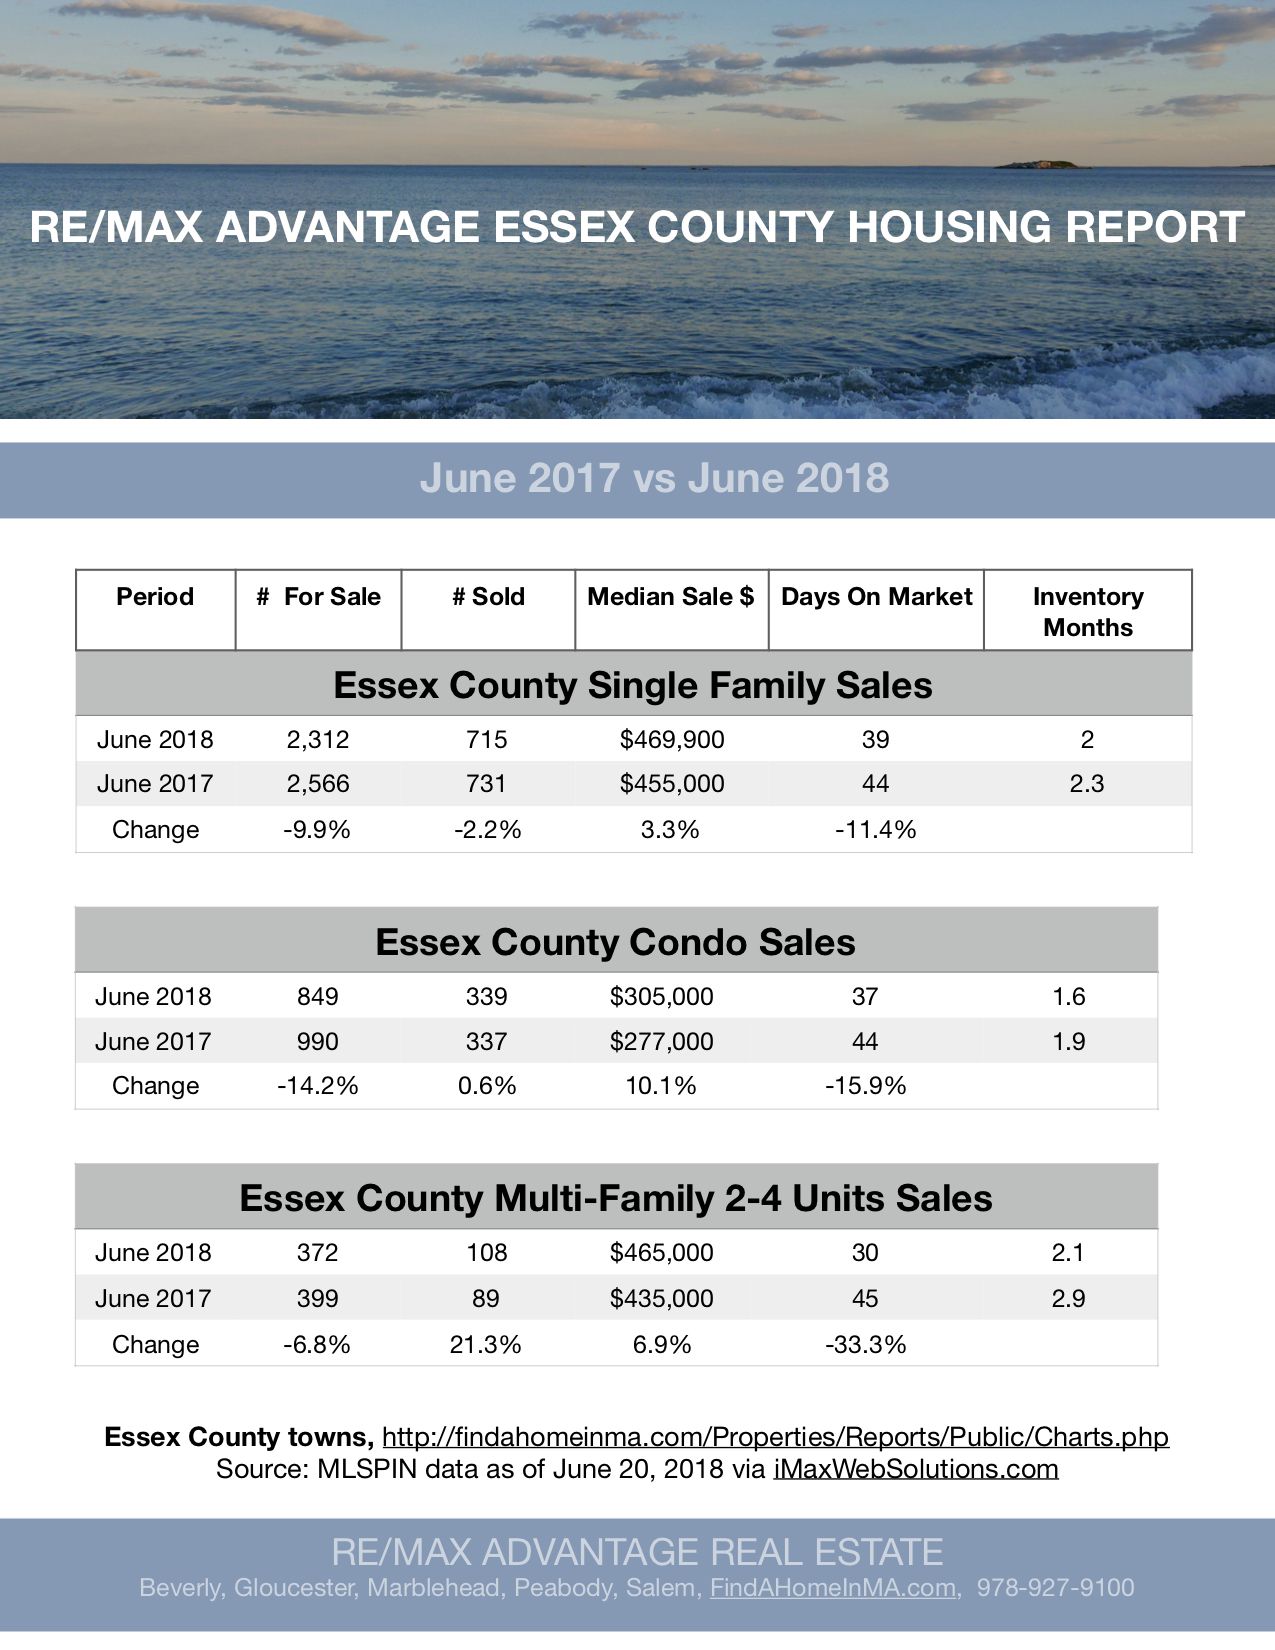
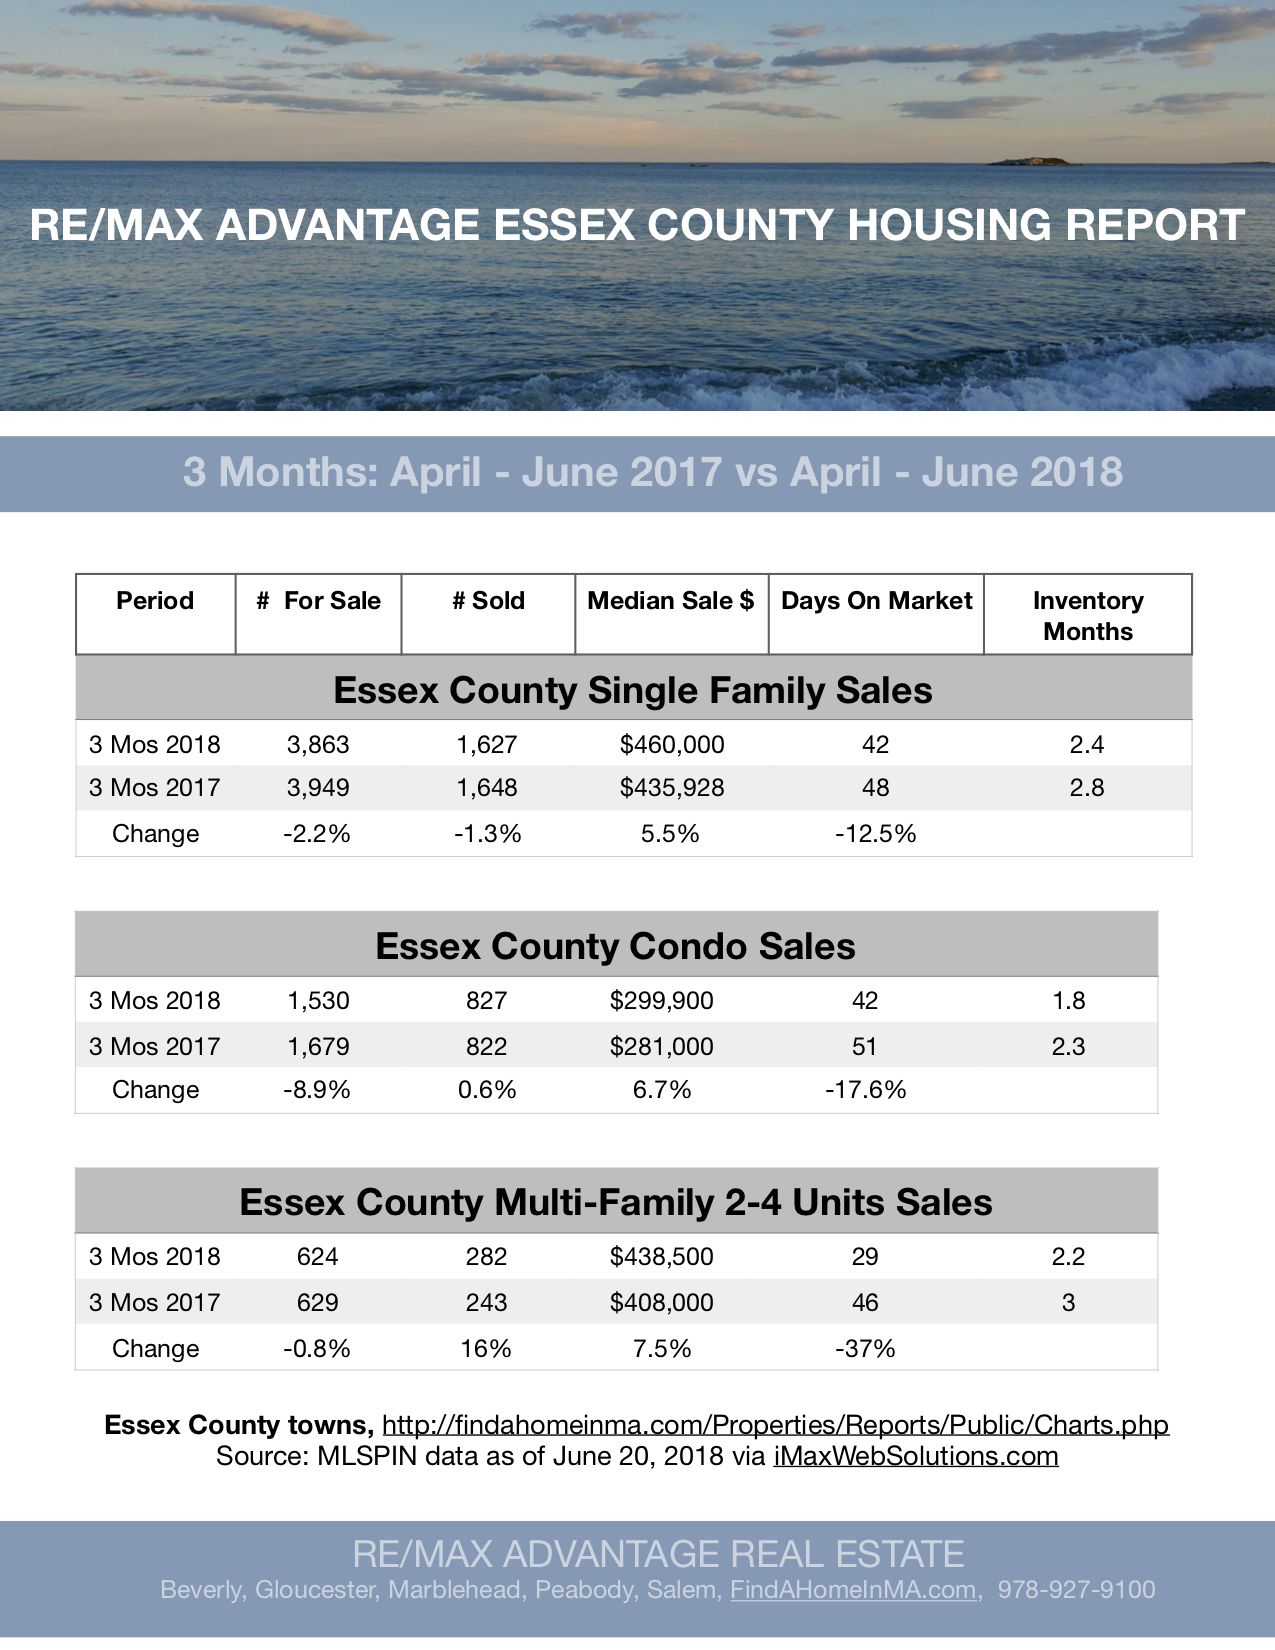
Essex County Housing Reports: June 2017 vs June 2018; April - June 2017 vs April - June 2018

Inventory down and sales prices up. - breakdown by property type:

Single Family: June: Inventory Down 9.9% and Sale Prices Up 3.3%:  3 Months Inventory Down 2.2% and Sale Prices Up 5.5%

Condo: June Inventory Down 14.2% and Sale Prices Up 10.1%:  3 Months Inventory Down 8.9% and Sale Prices Up  6.7% 

Muilti-Family: June Inventory Down 6.8% and Sale Prices Up 6.9%: 3 Months Inventory Down 0.8% and Sale Prices Up  7.5% 

To view data for every Essex County town, go to:  http://www.sullivanteam.com/Properties/Reports/Public/Charts.php 

To dowload the full Housing Report go to: http://sullivanteam.com/pages/EssexCountyHousingReports


Rising Demand Pushes Prices Higher - MA Average Home Equity Gain from Last Year + $24,000

Wow! MA average gian in home Equity from last year to this year is + $24,000.

With home prices rising across the country because of low inventory, homeowners gained over a trillion dollars in equity over the last 12 months, with the average homeowner gaining over $16,000!

Across the United States, there is a severe mismatch between the low number of houses for sale and the high demand for those houses! First-time homebuyers are out in force and are being met with a highly competitive summer real estate market.

According to the National Association of Realtors (NAR), the inventory of homes for sale “has fallen year-over-year for 36 consecutive months,” and now stands at a 4.1-month supply. A 6-month supply of inventory is necessary for a balanced market and has not been seen since August of 2012.

Is There Any Relief Coming? 

According to the CoreLogic’s 2018 Consumer Housing Sentiment Study, four times as many renters are considering buying homes in the next 12 months than homeowners who are planning to sell, “which is the crux of the available housing-supply imbalance.”

The map below shows the breakdown by state:


https://www.mykcm.com/2018/07/18/demand-for-homes-to-buy-continues-to-climb/