The Shorey Realty Group

The Shorey Realty Group
shoreyrealestate@gmail.com
781.962.4028

Are You Paying Too Much For Rent?

Chances are if you are renting you are spending too much of your income on your monthly housing expense. There is a long-standing ‘rule’ that a household should not pay more than 28% of their income on their rent or mortgage payment. This percentage allows the household to save money for the future while comfortably covering other expenses.

According to new data released from ApartmentList.com49.5 million renters in the United States were cost-burdened in 2017, meaning they spent more than 30% of their monthly incomes on rent. This accounts for nearly half of all renter households in the country and is up 3.1 million from 2007.

When a household is cost-burdened by their monthly housing expense, they are not as easily able to save money for the future. This is a big factor for many renters who dream of owning their own homes someday.

But there is hope for those who are able to save at least a 3% down payment! The percentage of income needed in the US to buy a home is significantly less than renting at 17.1%!

The chart below compares the historic percentage of income needed to rent and buy from 1985-2000 to the first quarter of 2018. As you can see, the cost of renting has climbed above historic numbers while the cost of buying dropped over the same period of time.


https://www.mykcm.com/2018/10/30/are-you-spending-too-much-on-rent/

Home Price Forecast

The Home Price Expectation Survey – A survey of over 100 market analysts, real estate experts, and economists conducted by Pulsenomics each quarter.

Zelman & Associates – The firm leverages unparalleled housing market expertise, extensive surveys of industry executives, and rigorous financial analysis to deliver proprietary research and advice to leading global institutional investors and senior-level company executives.

Mortgage Bankers Association (MBA) – As the leading advocate for the real estate finance industry, the MBA enables members to successfully deliver fair, sustainable, and responsible real estate financing within ever-changing business environments.

Freddie Mac – An organization whose mission is to provide liquidity, stability, and affordability to the U.S. housing market in all economic conditions extending to all communities from coast to coast.

The National Association of Realtors (NAR) – The largest association of real estate professionals in the world.

Fannie Mae – A leading source of financing for mortgage lenders, providing access to affordable mortgage financing in all markets always.

https://www.keepingcurrentmatters.com/?p=2063050


Essex County Housing Reports: September 2017 vs September 2018

Essex County Housing Reports: September 2017 vs September 2018; July - September 2017 vs July - September 2018

Inventory Down, Number of Sales Down and Sales Prices up Except Condos - breakdown by property type:

Single Family: September: Inventory Down 9% and Sale Prices Up 6.3%:  3 Months Inventory Down 4.6% and Sale Prices Up 4.9%

Condo: September Inventory Down 5.7% and Sale Prices Down 6.5%:  3 Months Inventory Down 3.9% and Sale Prices Up 3.4% 

Muilti-Family: September Inventory Down 12.4% and Sale Prices Up 13.5%: 3 Months Inventory Down 4.5% and Sale Prices Up 13.2% 

To view data for every Essex County town, go to:  http://www.sullivanteam.com/Properties/Reports/Public/Charts.php 

To dowload the full Housing Report go to: http://sullivanteam.com/pages/EssexCountyHousingReports

Buying Cheaper Than Renting in MA and 37 Other States

September Jobs Report, 3.7% Unemployment Rate, Lowest Since 1969

3.7% Unemployment Rate, Lowest Since 1969 - Positive For Housing
The September Jobs Report in 9 Charts


The share of the population that is in the labor force—defined as those working or actively searching for work—has hovered a bit below 63% this year. The rate has seen little sustained improvement or deterioration for the past five years. The share of the population that works was little changed last month, but has trended upward in recent years.
 
 
Participation rates are much higher for workers ages 25 to 54, where people are less likely to be out of the labor force due to retirement or education. The labor-force participation rate and employment-population ratio have both declined slightly in recent months.


The median spell of unemployment now lasts about nine weeks. This is much improved from the years right after the recession, but is still a few weeks longer than was typical during the strong labor markets of the late 1990s. Although job loss is now relatively rare, when it happens it can linger a bit longer than usual.
 
 
Even as the economy has improved, workers with different education levels face much different rates of unemployment. Those without a high-school degree have 5.5% unemployment while college graduates have an unemployment rate of just 2%.
 
 
Unemployment rates have trended down for workers of all races and genders in recent years. The unemployment rates for white women, black men and Hispanic women are all at the lowest in at least several decades.
 
 
With nine months down, 2018 is shaping up to be one of the stronger years of job growth since the recession.
 
 
Related Article: 

U.S. Unemployment Rate Falls to Lowest Level Since 1969 https://on.wsj.com/2Obbq68

Mortgage Rates Surge To 7 Year High - Time To Lock In a Mortgage

http://bit.ly/2NiLnoh

Mortgage Rates Surge Well Into New 7-Year Highs


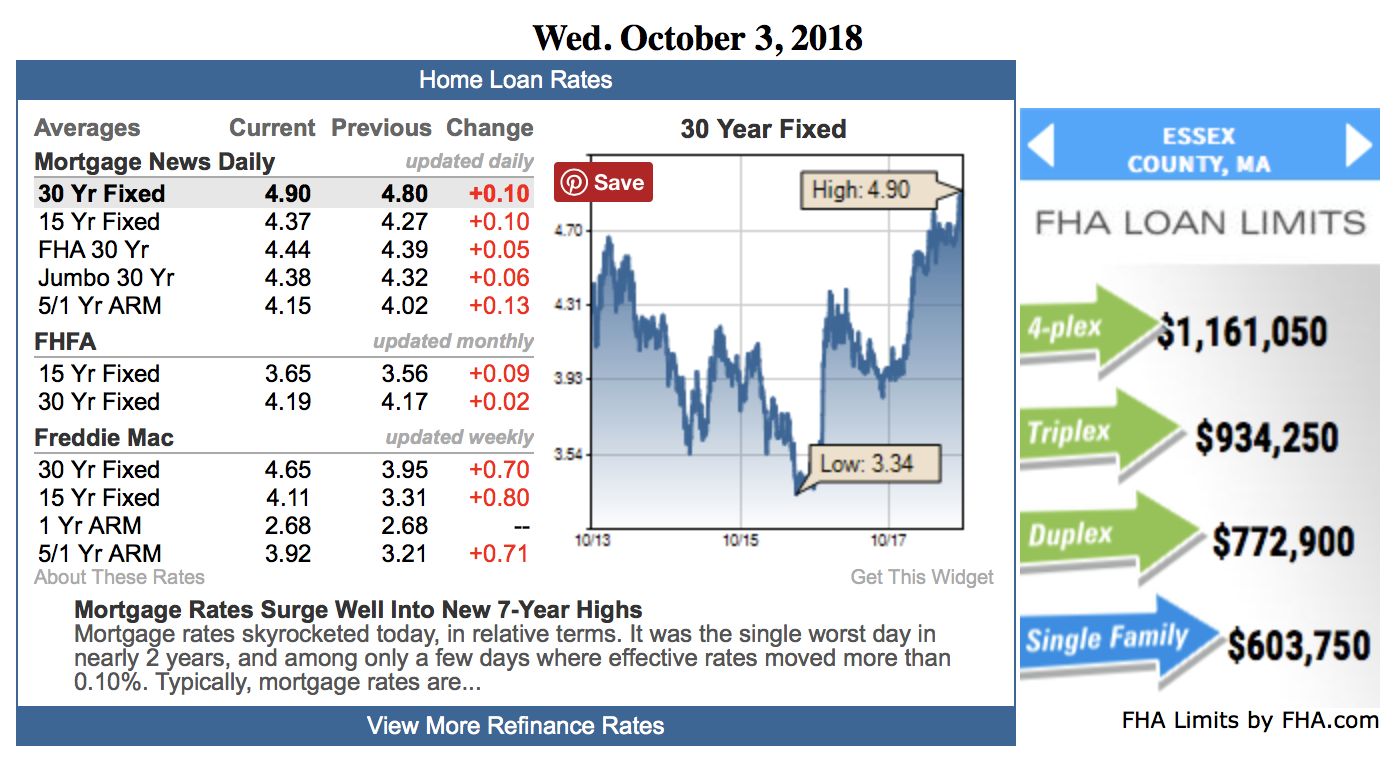
Mortgage rates skyrocketed today, in relative terms.  It was the single worst day in nearly 2 years, and among only a few days where effective rates moved more than 0.10%.  Typically, mortgage rates are offered in 0.125% increments.  We're able to track "effective rates" by examining the upfront costs associated with any given rate.  For instance, a quoted rate might not change from day today despite major changes in upfront costs/credits.  At a certain point, the upfront cost change is big enough that it makes more sense to jump up by the aforementioned 0.125% increment.

In other words, if you have a loan in process, an effective rate increase of 0.10% means there's a very good chance that you're looking at a 0.125% increase in rate today.  And if you're not, you'd instead be seeing this move in the form of higher upfront costs or lower lender credit.  Either way, it was a big, bad move.

So why did rates spike so much?  The simple answer is that this morning's economic data drove home some of the harsh realities that have been plaguing rates in general for the past few years--and especially over the past 2 months.  Simply put, when the economy is firing on all cylinders and when traders have reason to defend against the possibility of even faster growth and inflation (something today's data may well suggest), rates are forced to move higher.

The complicated part of the answer has to do with the extra momentum that can creep into underlying market movements on days like today.  To an undetermined extent, traders are definitely positioning for more unfriendly rate news with Friday morning's big jobs report.  That's our first major opportunity for reprieve, but reprieve should not be taken for granted.  Rates could go even higher if Friday's data strikes a similar chord to today's.


Loan Originator Perspective

Bond markets tanked today on robust economic and employment data.  We're looking at treasury yields that haven't been seen since 2011, with no end to the losses in sight.  I have been locking early for months, and today's a great illustration of why.  Since rate sheets don't yet reflect today's market losses, locking now (instead of waiting for tomorrow) is the move here. -Ted Rood, Senior Originator

Today's Most Prevalent Rates

  • 30YR FIXED - 4.875-5.0%
  • FHA/VA - 4.5%
  • 15 YEAR FIXED - 4.375-4.5%
  • 5 YEAR ARMS -  4.25%-4.75% depending on the lender


Ongoing Lock/Float Considerations
 

  • Rates continue coping with several big-picture headwinds, including: the Fed's rate hike outlook (and general policy tightening), the increased amount of Treasury issuance to pay for the tax bill (higher bond issuance = higher rates), and the possibility that fiscal stimulus results in higher growth/inflation (which certainly seems to be the case so far in 2018).

  • While rates were able to recover and stay sideways in the summer months, September and October have seen a surge up to the highest levels in more than 7 years. 

  • Upward pressure can continue as long as economic growth and inflation continue running near long-term highs.  Stay defensive (i.e. generally more lock-biased).  It will take a big change in economic fundamentals or geopolitical risk for the big picture to change.  Such things tend to not happen as quickly as we'd like.
  • Rates discussed refer to the most frequently-quoted, conforming, conventional 30yr fixed rate for top tier borrowers among average to well-priced lenders.  The rates generally assume little-to-no origination or discount except as noted when applicable.  Rates appearing on this page are "effective rates" that take day-to-day changes in upfront costs into consideration.