Housing Report, August vs July 2026: National vs Essex County, MA 8/22/2026:
National Housing Report (Homes and Condos): Normal Summer Slow Down As Prices and Unit Sales Fell from July.
Unit sales fell -2.0% to 3.98 Million, median sale prices fell -1.2% to $429,100, Days On Market rose from 57 to 60. Active Listings rose +3.6% to 1.62 Million, Months of Inventory rose to 4.9 Months from 4.6 months and 20.4% of Active Listings had price reductions which averaged 5%. However, prices rose 1.6% year over year.
National Bottom Line: August was a slower, more negotiable and increasingly balanced national market. Compared to the South, the West, and Central USA, the Northeast Region recorded the strongest increase in Sold Prices, +4.3% even though median asking prices declined -3.6%. This means sellers were more realistic in their asking prices and inventory remained limited which kept prices up.
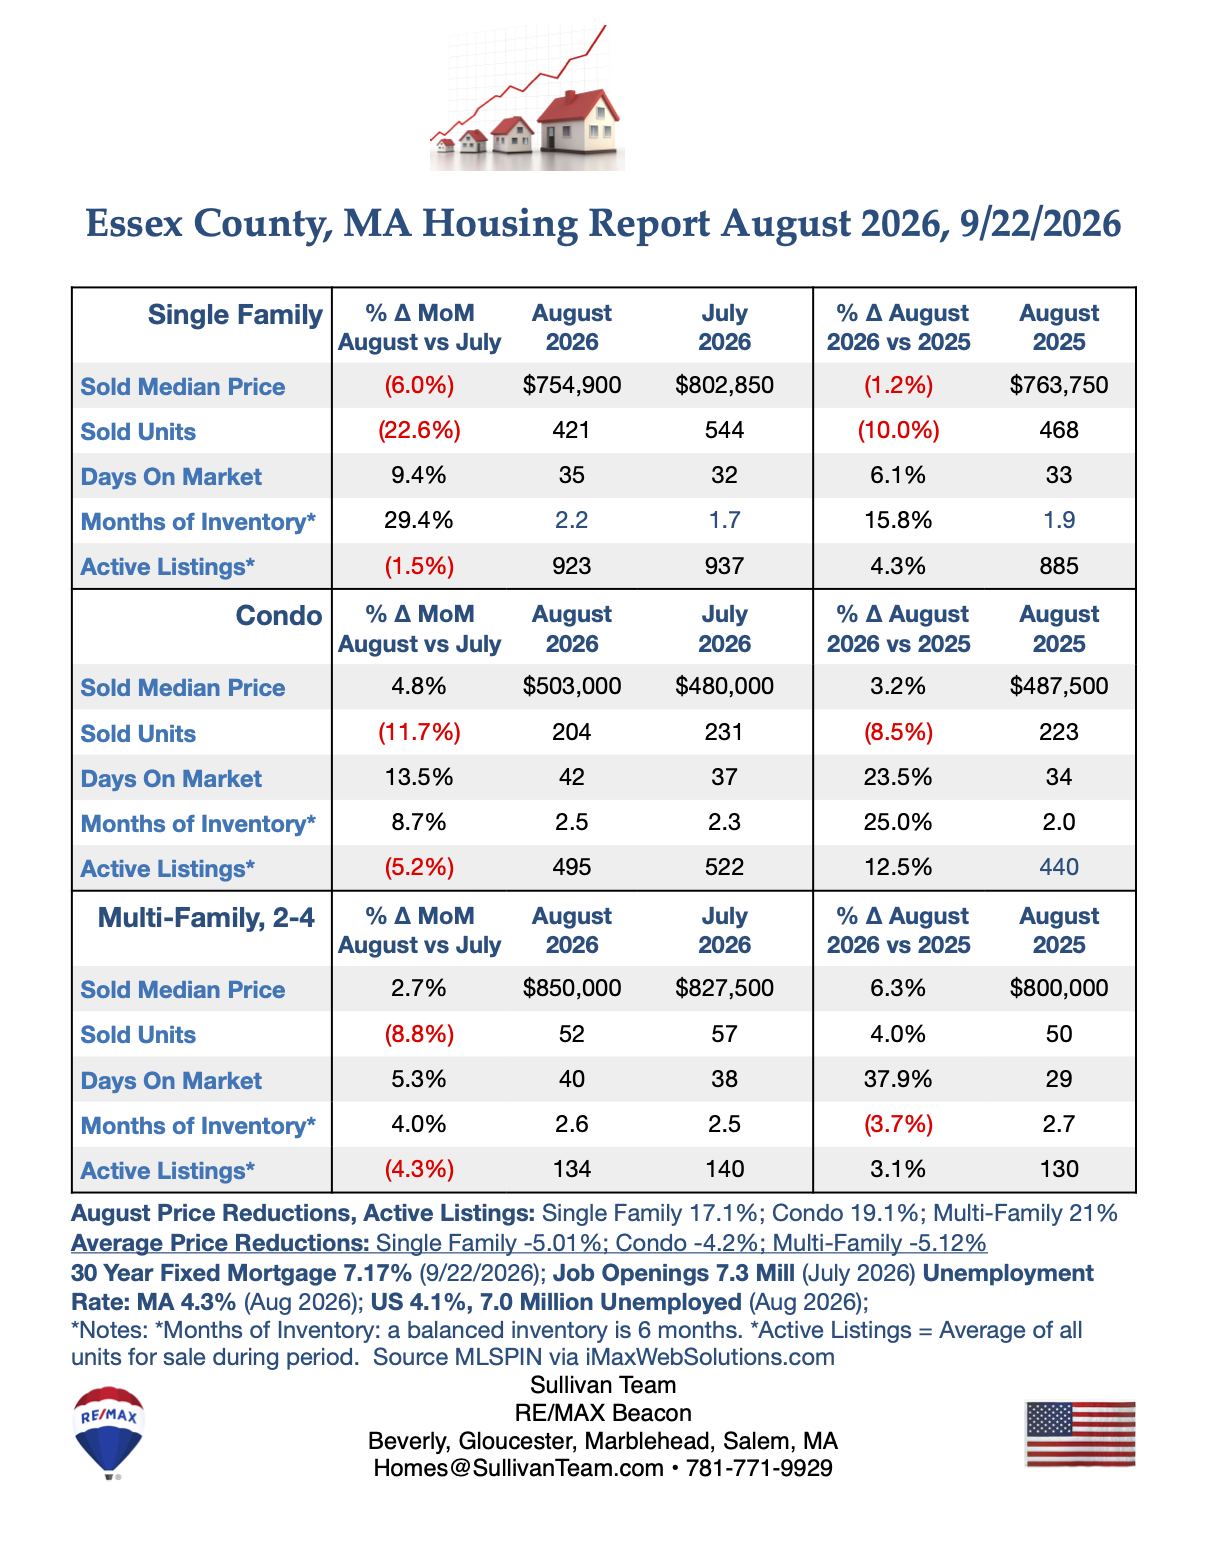
Essex County MA: August 2026 vs July 2026 - Summer Slowdown Continued as mortgage rates remained elevated! Month over month, Single-Family, Condo and Multi-Family unit sales and the number of active listings were all down. Months of inventory and days on market also rose, indicating a market slowdown. Median prices were mixed: Single Families down -6%, Condos Up +4.8%, 2-4 unit Multi-Families up +2.7%.
Essex County MA: Median Sold Price to Median List Price Ratio - August 2026: Single Families Sold for 94.4%; Condos Sold for 98.8%; Multi-Families Sold for 97.7%.
Percent of Active Listings With Price Reductions - August 2026: Single-Families17.1%, Condos 19.1% and 2-4 Unit Multi-Families 21.0%. Average Price Reductions: Single-Families -5.01%; Condos -4.2%; Multi-Families -5.12%.
Current Months of Inventory: (a balanced market has 6 months of inventory): Single-Families 2.2 months, Condos 2.5 months, 2-4 Unit Multi-Families 2.6 months.
Bottom line: Current low inventory favors sellers who price their properties correctly.
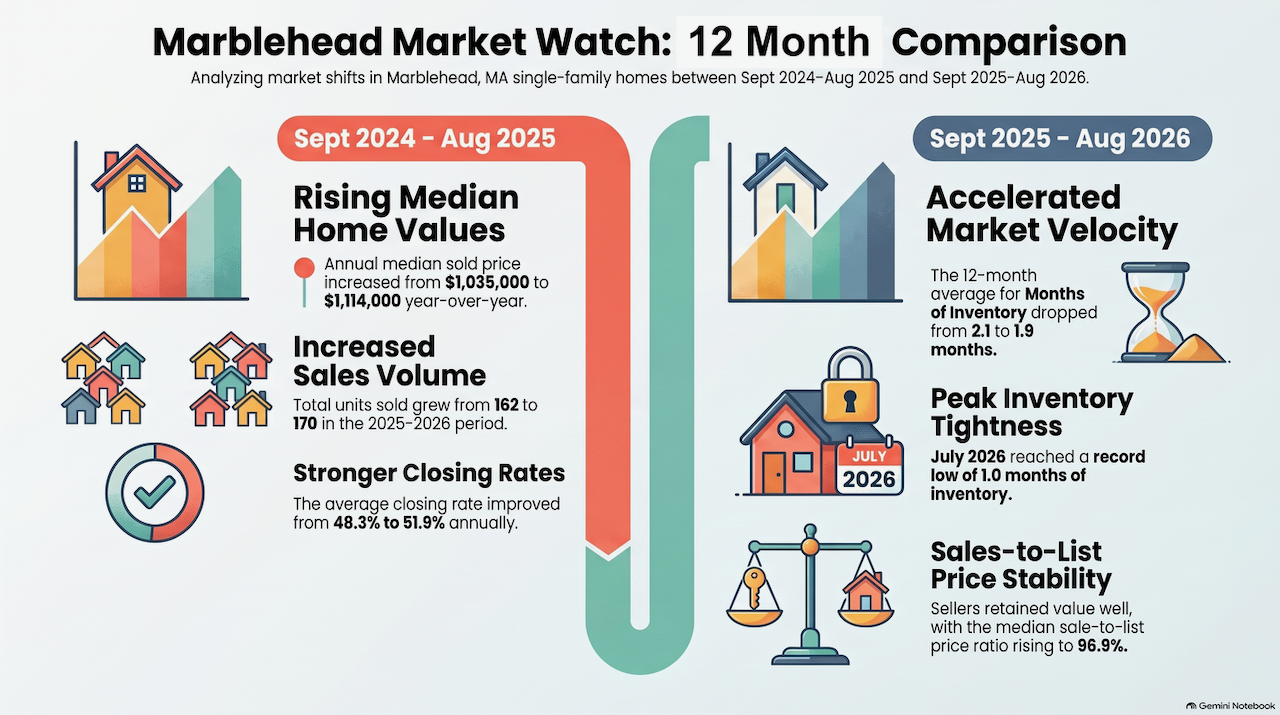
How is the Marblehead MA Single Family Real Estate Market As Of 8/31/2026?
Year over Year Median Prices rose 7.6% to $1,114,000; Days On Market were 41; Sold Prices were 96.9% of List Prices; Only 1.9 Months of Inventory (A Balanced Market has 6 months of inventory); 51.9% of Active Listings Sold each month.
Brought to you by:
Sullivan Team - RE/MAX Beacon - Kathy & Terry Sullivan
Search Criteria: Single Family; Listing Status: Active or Contingent; Price: $500,000 - $20,000,000 Communities: Marblehead, MA MLS: MLSPIN
Query Time: 0.89790 seconds, Total Time: 1.00089
The information in these listings was gathered from third party resources including the seller and public records. MLS Property Information Network, Inc. and its subscribers disclaim any and all representations or warranties as to the accuracy of this information.
NEREN Listings Copyright 2026 New England Real Estate Network, Inc. All rights reserved. This information is deemed reliable, but not guaranteed. The data relating to real estate for sale on this website comes in part from the VOW Program of NEREN. Data last updated 2026-08-30 22:00:21 This display of listings may or may not be the entire compilation of listings from the entire NEREN database, and NEREN does not guarantee the accuracy of such information.
Privacy Policy: We do not sell member information to third party vendors.
<!doctype html>Homes for Sale in Salem, MA | Sullivan Team RE/MAX
Homes for Sale in Salem, Massachusetts 01970
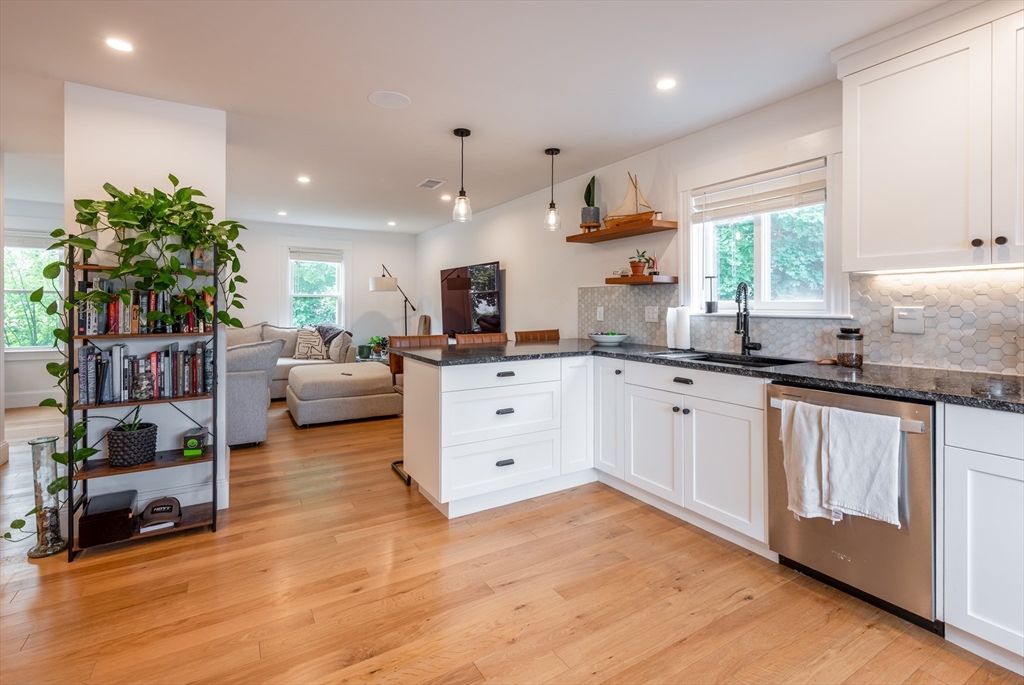
Explore 23 current single-family homes from the Salem MLS search, from homes with renovation potential to move-in-ready residences and distinctive historic properties.
Current Salem MA Real Estate Listings
Salem offers an unusually broad mix of housing: classic New England architecture, established residential neighborhoods, homes near downtown and the commuter rail, and properties with room for buyers to renovate or personalize. The current selection below shows that range across multiple price points and home styles.
Click any property photo, address, or “View Property Details” button for the full listing. For help comparing these homes, arranging a private showing, or discussing the Salem and North Shore real estate market, contact Kathy & Terry Sullivan of the Sullivan Team at RE/MAX at 781-771-9949 or kathy@sullivanteam.com.
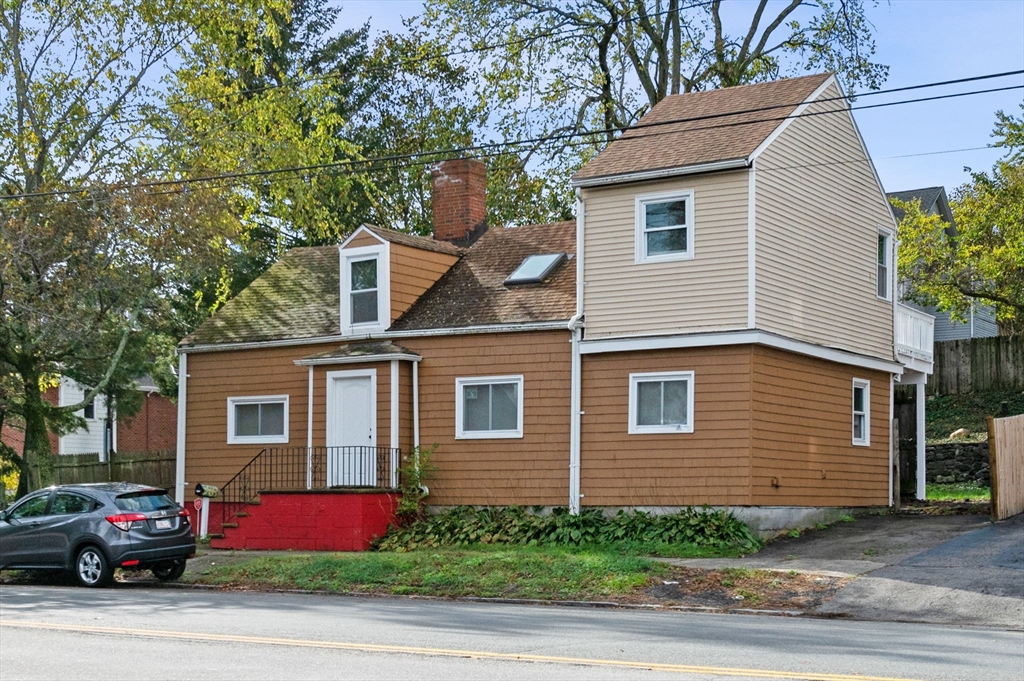
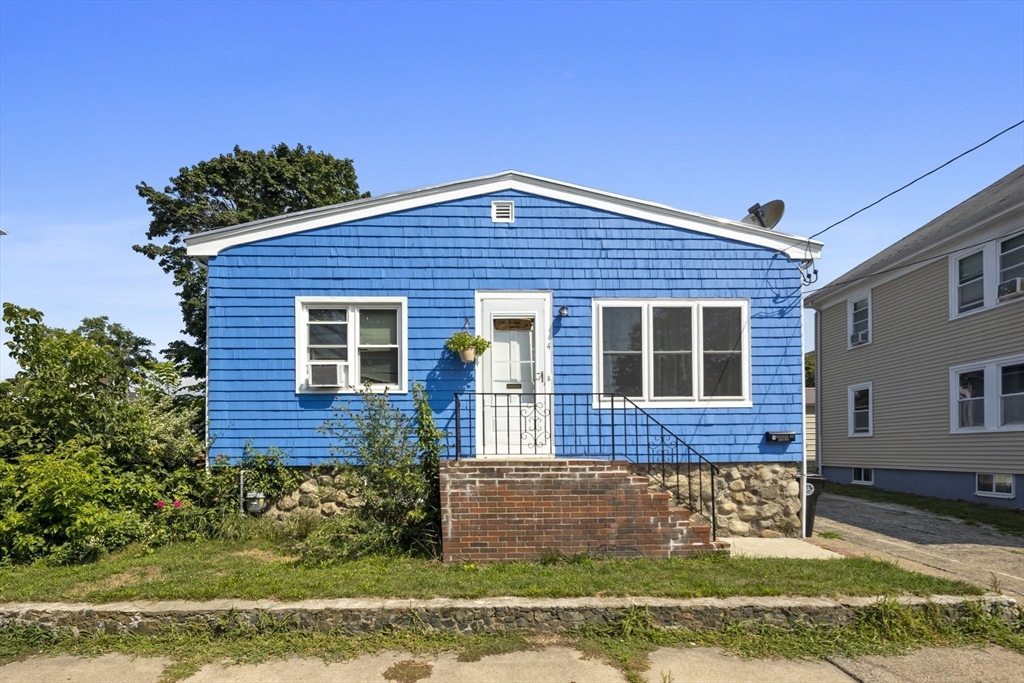
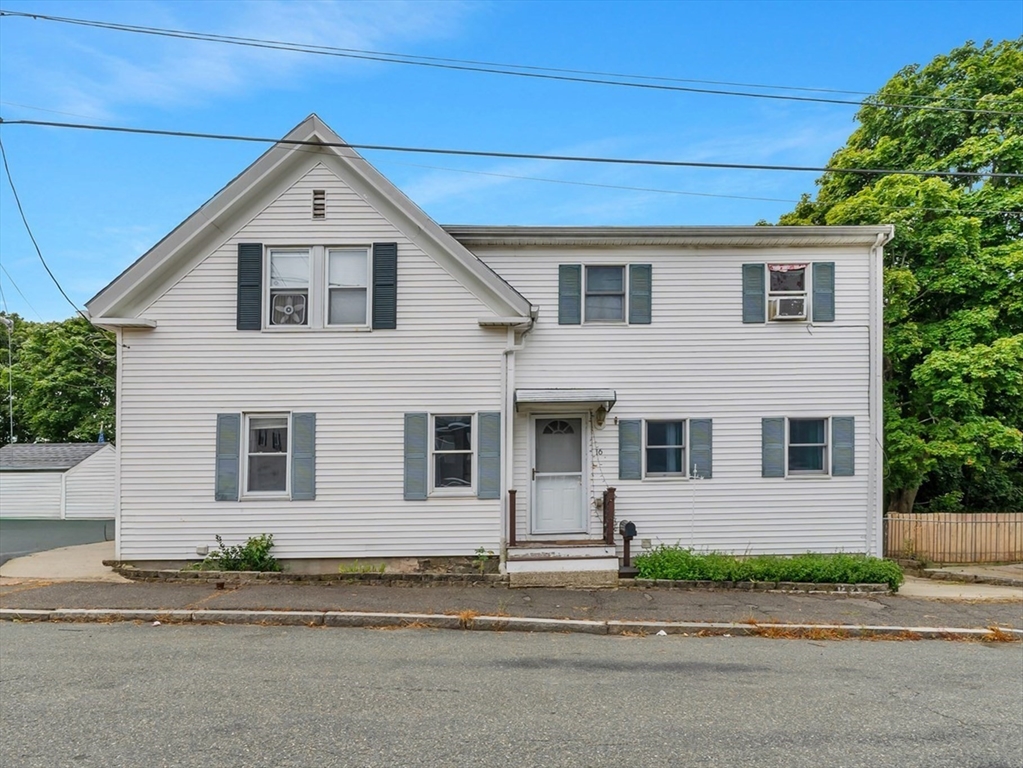
Unique opportunity to build sweat equity in a highly convenient area with easy access to downtown Salem and downtown Peabody as well as Highland Ave and Bridge St. This property offers two beds and a full bath in the original main house and the addition offers easy opportunity for a potential accessory dwelling with one bed and a full bath. Large fenced yard, off street parking for 2-3 cars make this a great project…
Welcome to 400 Jefferson Avenue in Salem, a home filled with charm, character, and plenty of opportunity to make it your own. The interior is ready for cosmetic updating, and the price reflects the opportunity for a buyer to put in some sweat equity and add value over time.The first floor features hardwood flooring throughout, along with charming built-ins and architectural details that give the home warmth and…
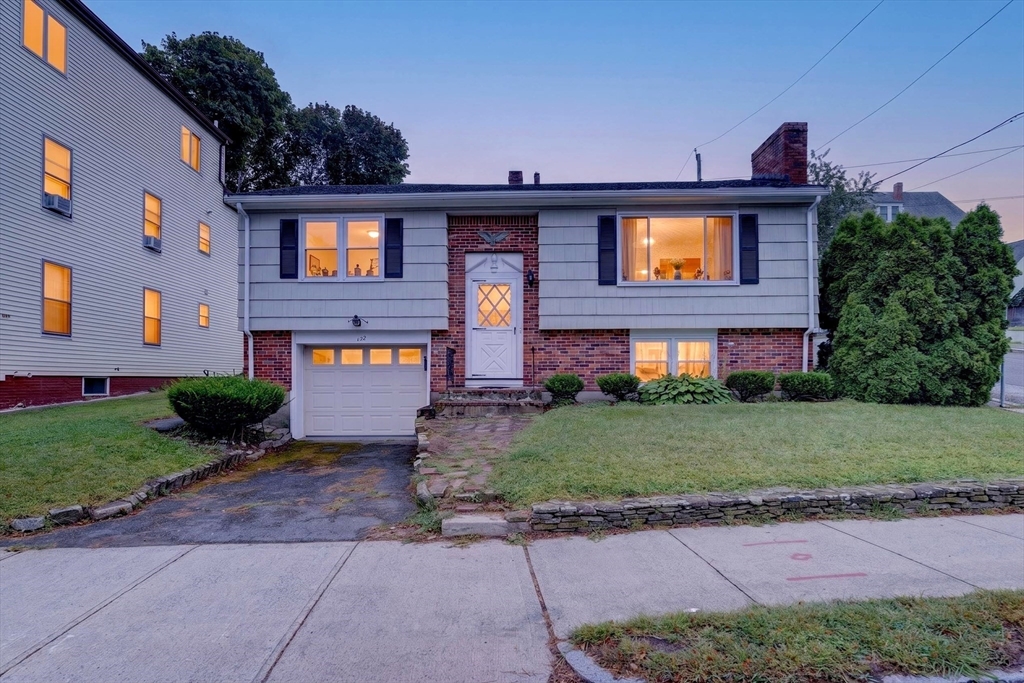
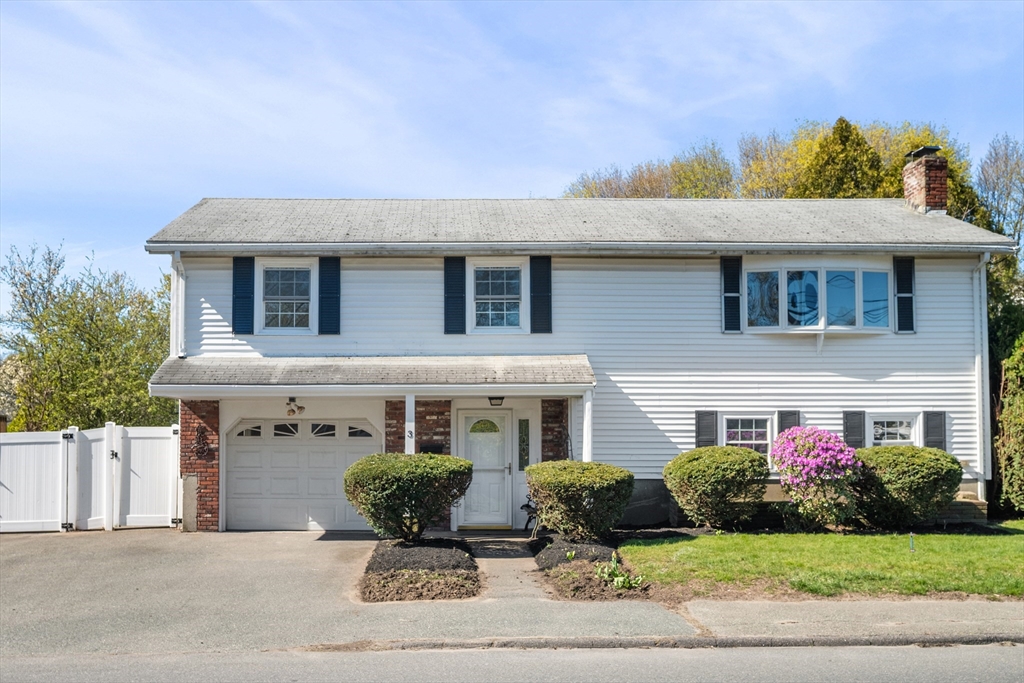
Don't miss this charming split entry raised ranch on a corner lot with endless possibilities. 2 beds & 2 baths. New heating system. Newer roof and windows. Nice yard with parking for 3 cars.This home is ready for your personal touch. Located near the Peabody line with easy access to major highways, downtown Salem, downtown Peabody shopping, restaurants, and the commuter rail.
Don't miss this charming single-family ranch in the desirable Castle Hill neighborhood! Full of potential and endless possibilities, this home is ready for your personal touch. The property features expansive yard a two-plus-car driveway, a spacious eat-in kitchen with a pantry, and a bright four-season porch that also serves as a convenient mudroom. The home offers three generously sized bedrooms and a full tiled…
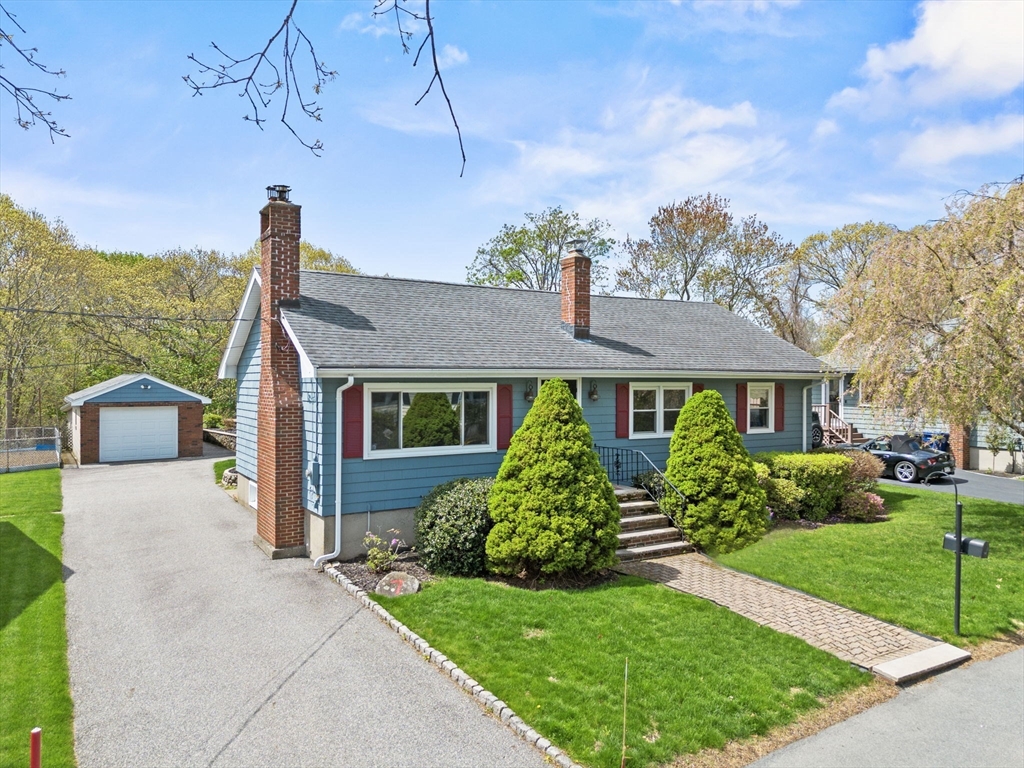
NEW PRICE! Located in North Salem on a quiet side street, this 1966 ranch offers a solid foundation, a desirable layout, and plenty of potential for its next owner. While some cosmetic updating would enhance the interior, the home already features an appealing open-concept floor plan connecting the living room, dining area, and kitchen—a layout that feels surprisingly current and provides flexibility for everyday…
4 Beds • 1 Full Bath • 1 Half Bath • 1,994SF • Other (See Remarks)
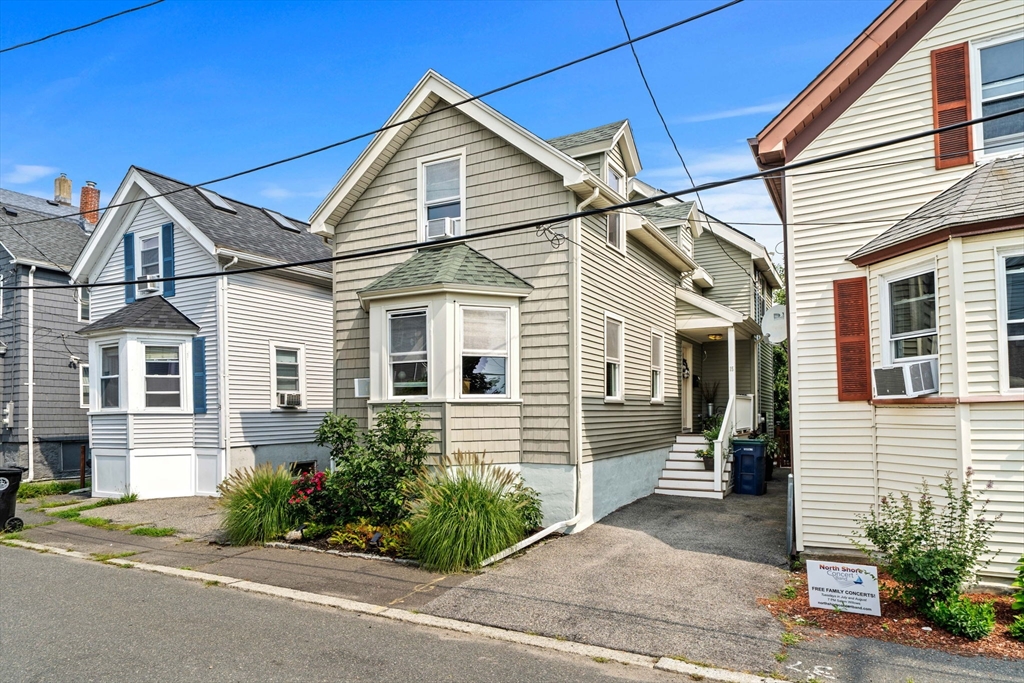
Opportunity knocks! This spacious single-family home offers great bones, a fantastic layout, and an unbeatable location. Filled with natural light and featuring high ceilings throughout, this home is ready for its next chapter and awaits your design and renovation ideas. The first floor showcases original hardwood floors and charming period details, a double living room with a pellet stove, and a large open kitchen…
Welcome to this beautifully maintained 3-bedroom, 2-bath single-family home ideally situated in Salem, right on the Peabody line and just minutes from all that the North Shore has to offer. The home features an updated kitchen as well as an updated heating system and central AC, offering both comfort and peace of mind for its next owner. The spacious layout provides three well-appointed bedrooms, two full bathrooms,…
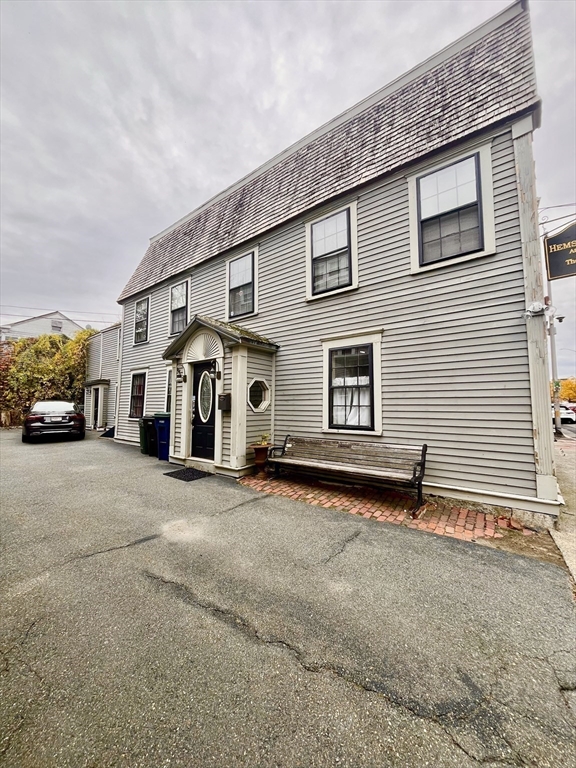
Well located 1787 Gambrel office building directly across from courthouse , 1 block to train and parking garage. Currently used as Attorney At Law Office. Huge plus is the off street parking allowing for 2 car tandem parking. The building also has central air and is within moments to banks, restaurants. Very high "in and out" index. BUyers and buyers agent should determine of a change of usage is possible.
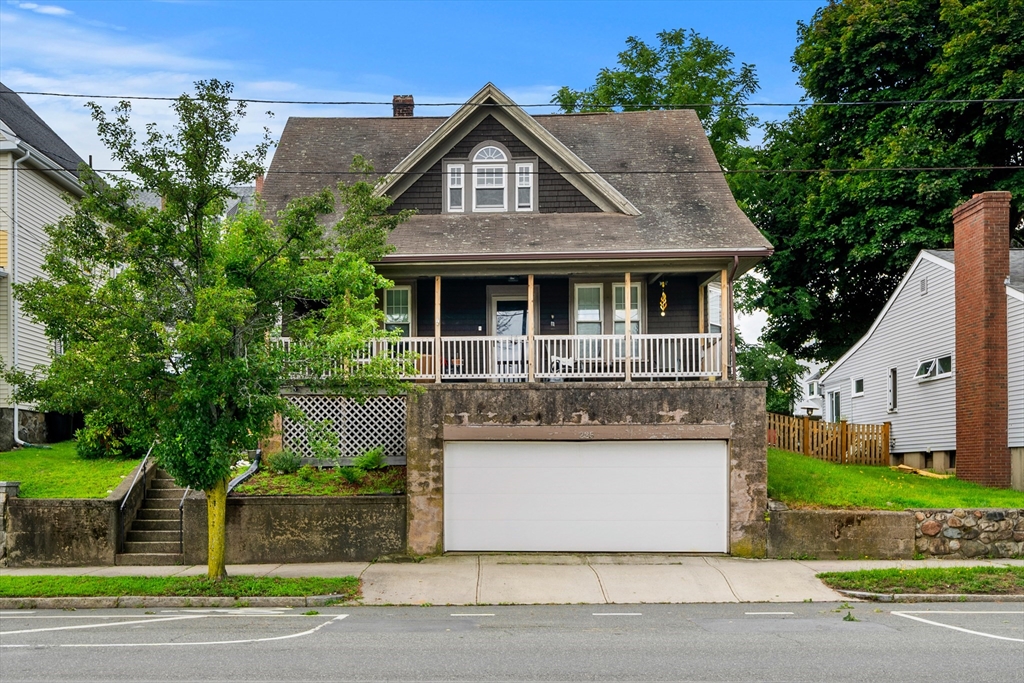
This charming four-bedroom Salem home blends classic 1900s character with thoughtful updates and a highly convenient location. A welcoming covered porch leads into a bright living room featuring a fireplace, hardwood floors, and original woodwork. The formal dining room includes a beautiful built-in cabinet, while the spacious eat-in kitchen opens through French doors to the fenced backyard.The flexible layout…
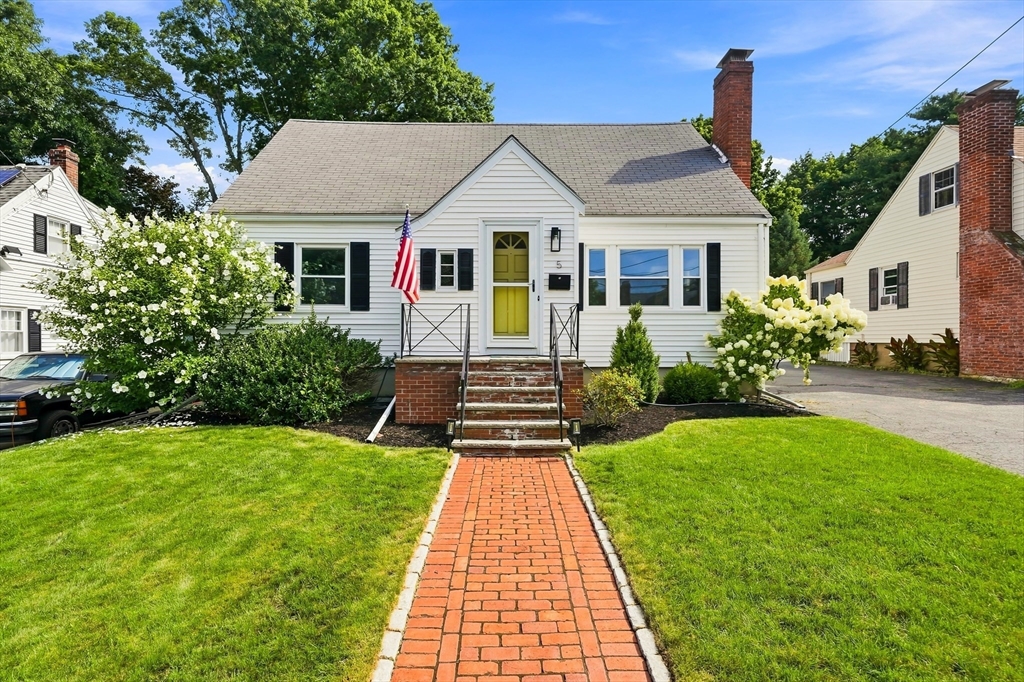
Welcome to this beautifully updated classic New England Cape, ideally located just steps from Vinnin Square in historic Salem, Massachusetts. Blending timeless charm with thoughtful modern updates, this home is truly move-in ready. Step inside to gleaming hardwood floors and a warm, inviting living room centered around a cozy wood-burning fireplace. The main level also features a spacious dining room, an updated…
WELCOME TO THIS SPACIOUS SALEM COLONIAL WITH FLEXIBLE LIVING SPACE! This 4-bedroom, 3-bath home offers a comfortable layout with generous living areas, hardwood flooring, and a well-appointed kitchen with stainless steel appliances. The finished lower level adds an informal kitchen area, full bath, laundry, and bonus rooms, creating excellent flexibility for additional living space, recreation, or a home office.…
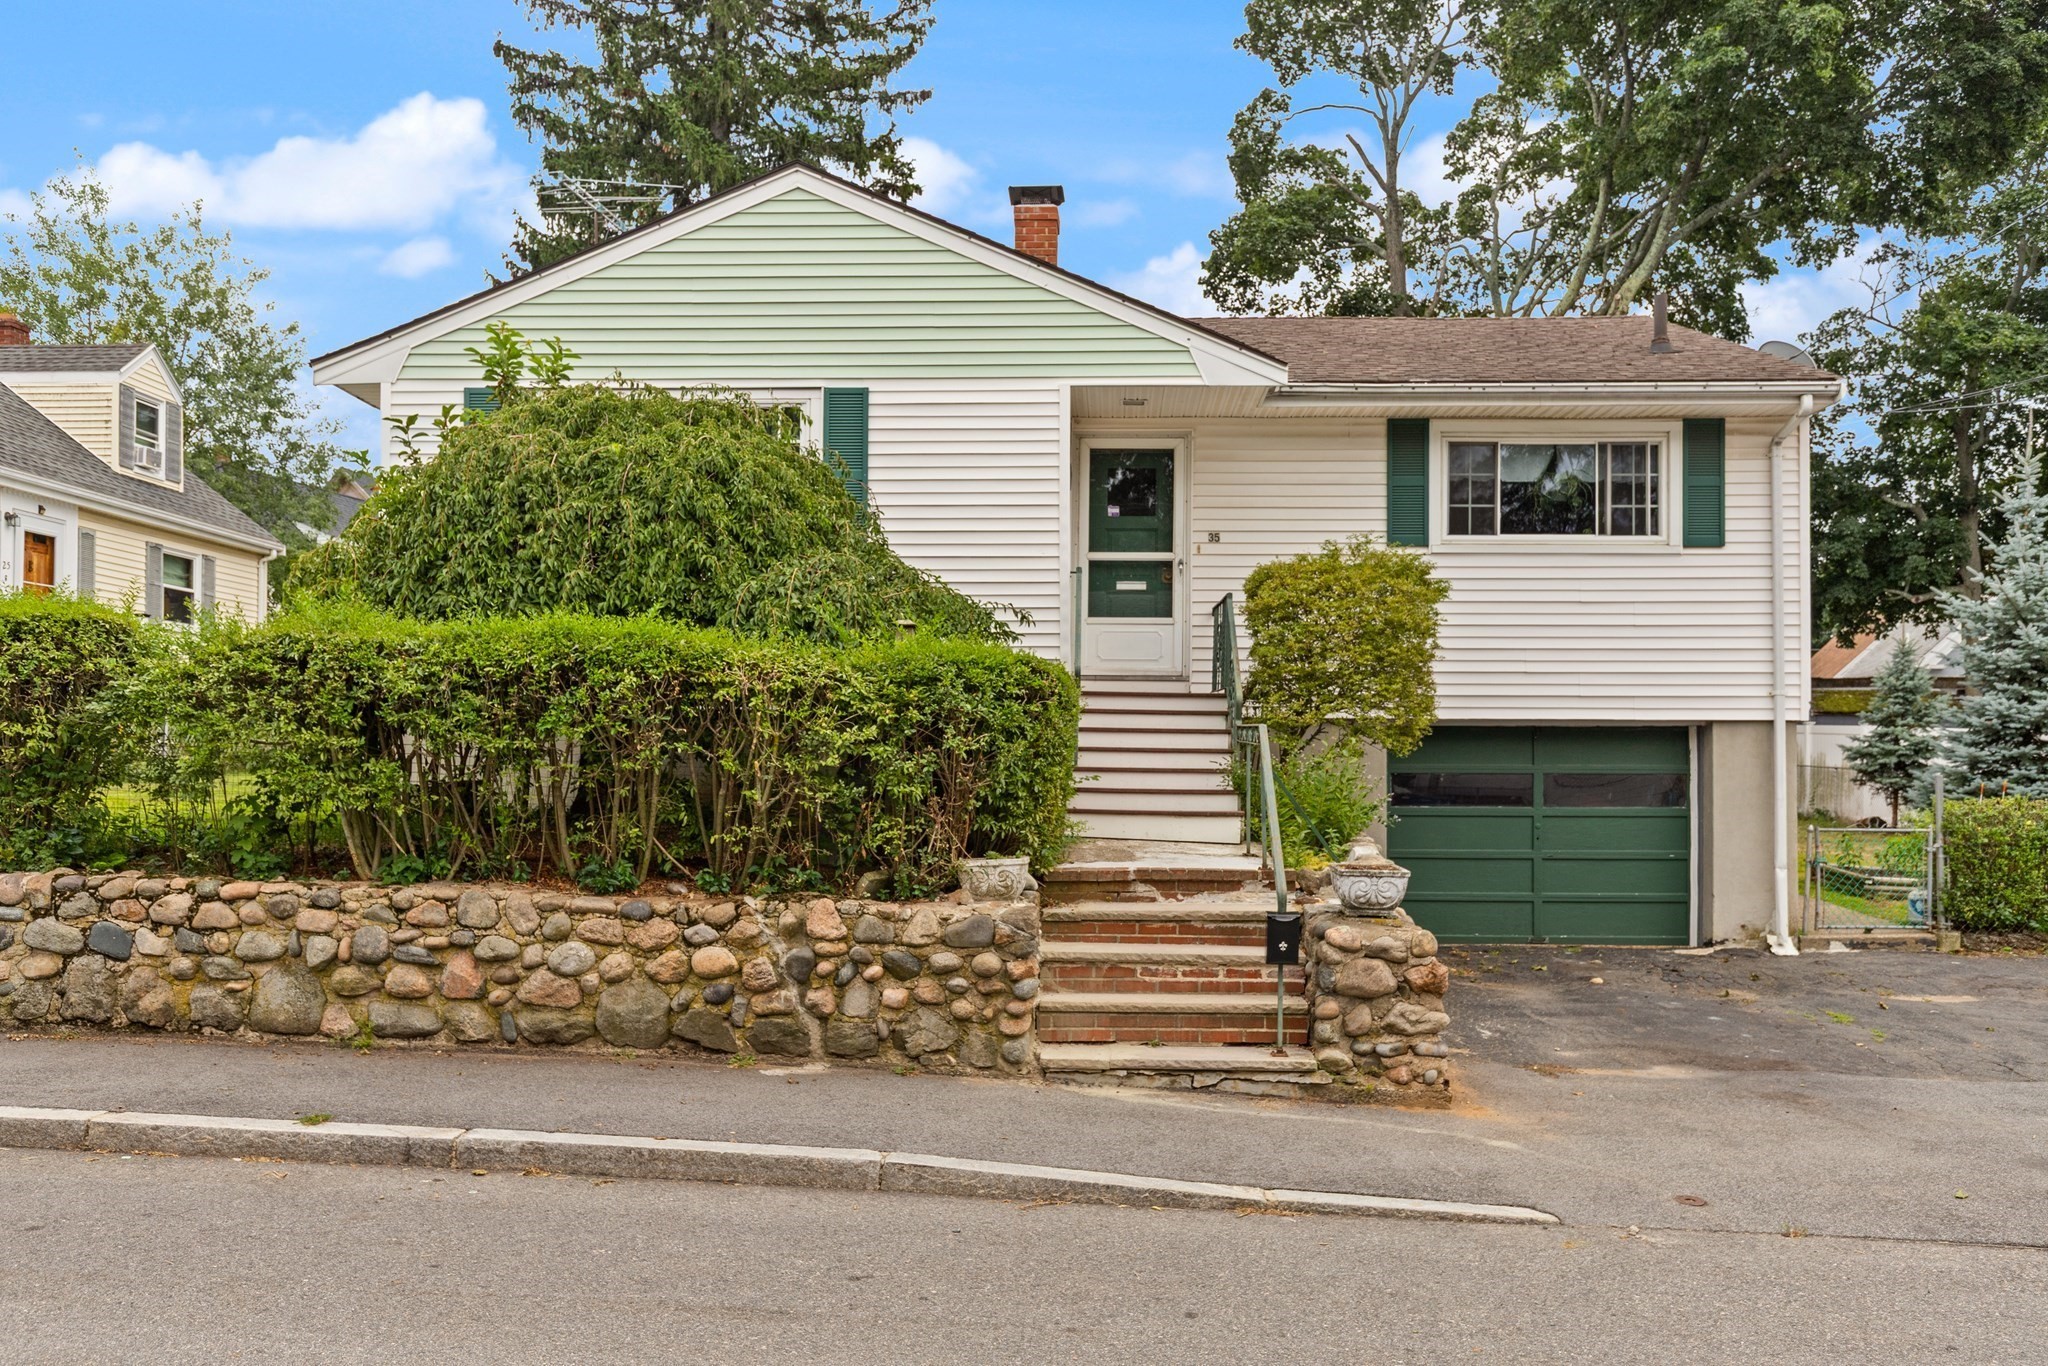
Lovingly maintained by its original owner & located on a dead end street you will find this warm & welcoming ranch is filled w/charm & character! The exterior sets the tone as you step into a sun-filled living room featuring HW floors, a classic brick-faced fireplace, & a bow window that frames the space w/natural light. The spacious eat-in kitchen offers plenty of room for cooking & gathering, & opens to a…
Move right in to this well kept 3 bedroom 1.5 bath with 1 car attached garage. Located in desirable Witchcraft Heights neighborhood, this home features freshly refinished hardwood floors and new paint throughout. Sun-splashed bonus room off of the kitchen with cathedral ceiling and sliders to deck. Updated bathroom features stylish tile and new vanity. Kitchen has cherry cabinets, granite counters and breakfast bar.…
OPEN HOUSE SATURDAY AND SUNDAY! Enjoy coastal Salem living in this updated 3-bedroom, 1.5-bath single-family home. The first floor features an open layout with hardwood floors, recessed lighting, a dining area, and a living room with a bay window and stone-surround fireplace. The kitchen offers white shaker cabinetry, granite counters, stainless steel appliances, gas cooking, a tile backsplash, breakfast bar, and…
Located on a quiet side street yet close to all that Salem has to offer, this 3-bedroom, 3-bath home offers comfortable living space and plenty of flexibility. The main level features a generous living room, dedicated dining room, and a spacious kitchen where family and friends can gather. Down the hall are three well proportioned bedrooms and two beautifully renovated full bathrooms. The finished lower level adds…
3 Beds • 2 Full Baths • 1 Half Bath • 1,843SF • Other (See Remarks)
This is a townhouse functions more like a single single family than condo. It's beautifully designed townhome built in 2024 and perfectly positioned to enjoy the best of Salem living. Start your mornings with coffee from a nearby café, hop on the commuter rail less than .5 mile away, or spend evenings exploring Salem’s restaurants, waterfront parks, and historic charm. Inside, the sunny open-concept layout was made…
Welcome to 84 Almeda St. West, where comfort meets convenience and your backyard becomes your own private oasis. Tucked into a quiet neighborhood with easy access to Highland Ave., downtown Salem, and South Peabody, this home offers a flexible layout with a first-floor primary bedroom, full bath with laundry, mudroom, and garage access or full walk out to yard. On the main level, enjoy an open-concept living area…
Rare Main Post & Beam! The character and charm will draw you in and you'll never want to leave the neighborhood! The first floor has a versatile open floor plan you will love hanging out and hosting in. The kitchen was recently updated & has a tremendous functional kitchen island that includes storage, prep space and doubles as a built in table or breakfast bar to eat at. The adjacent living room is open yet feels…
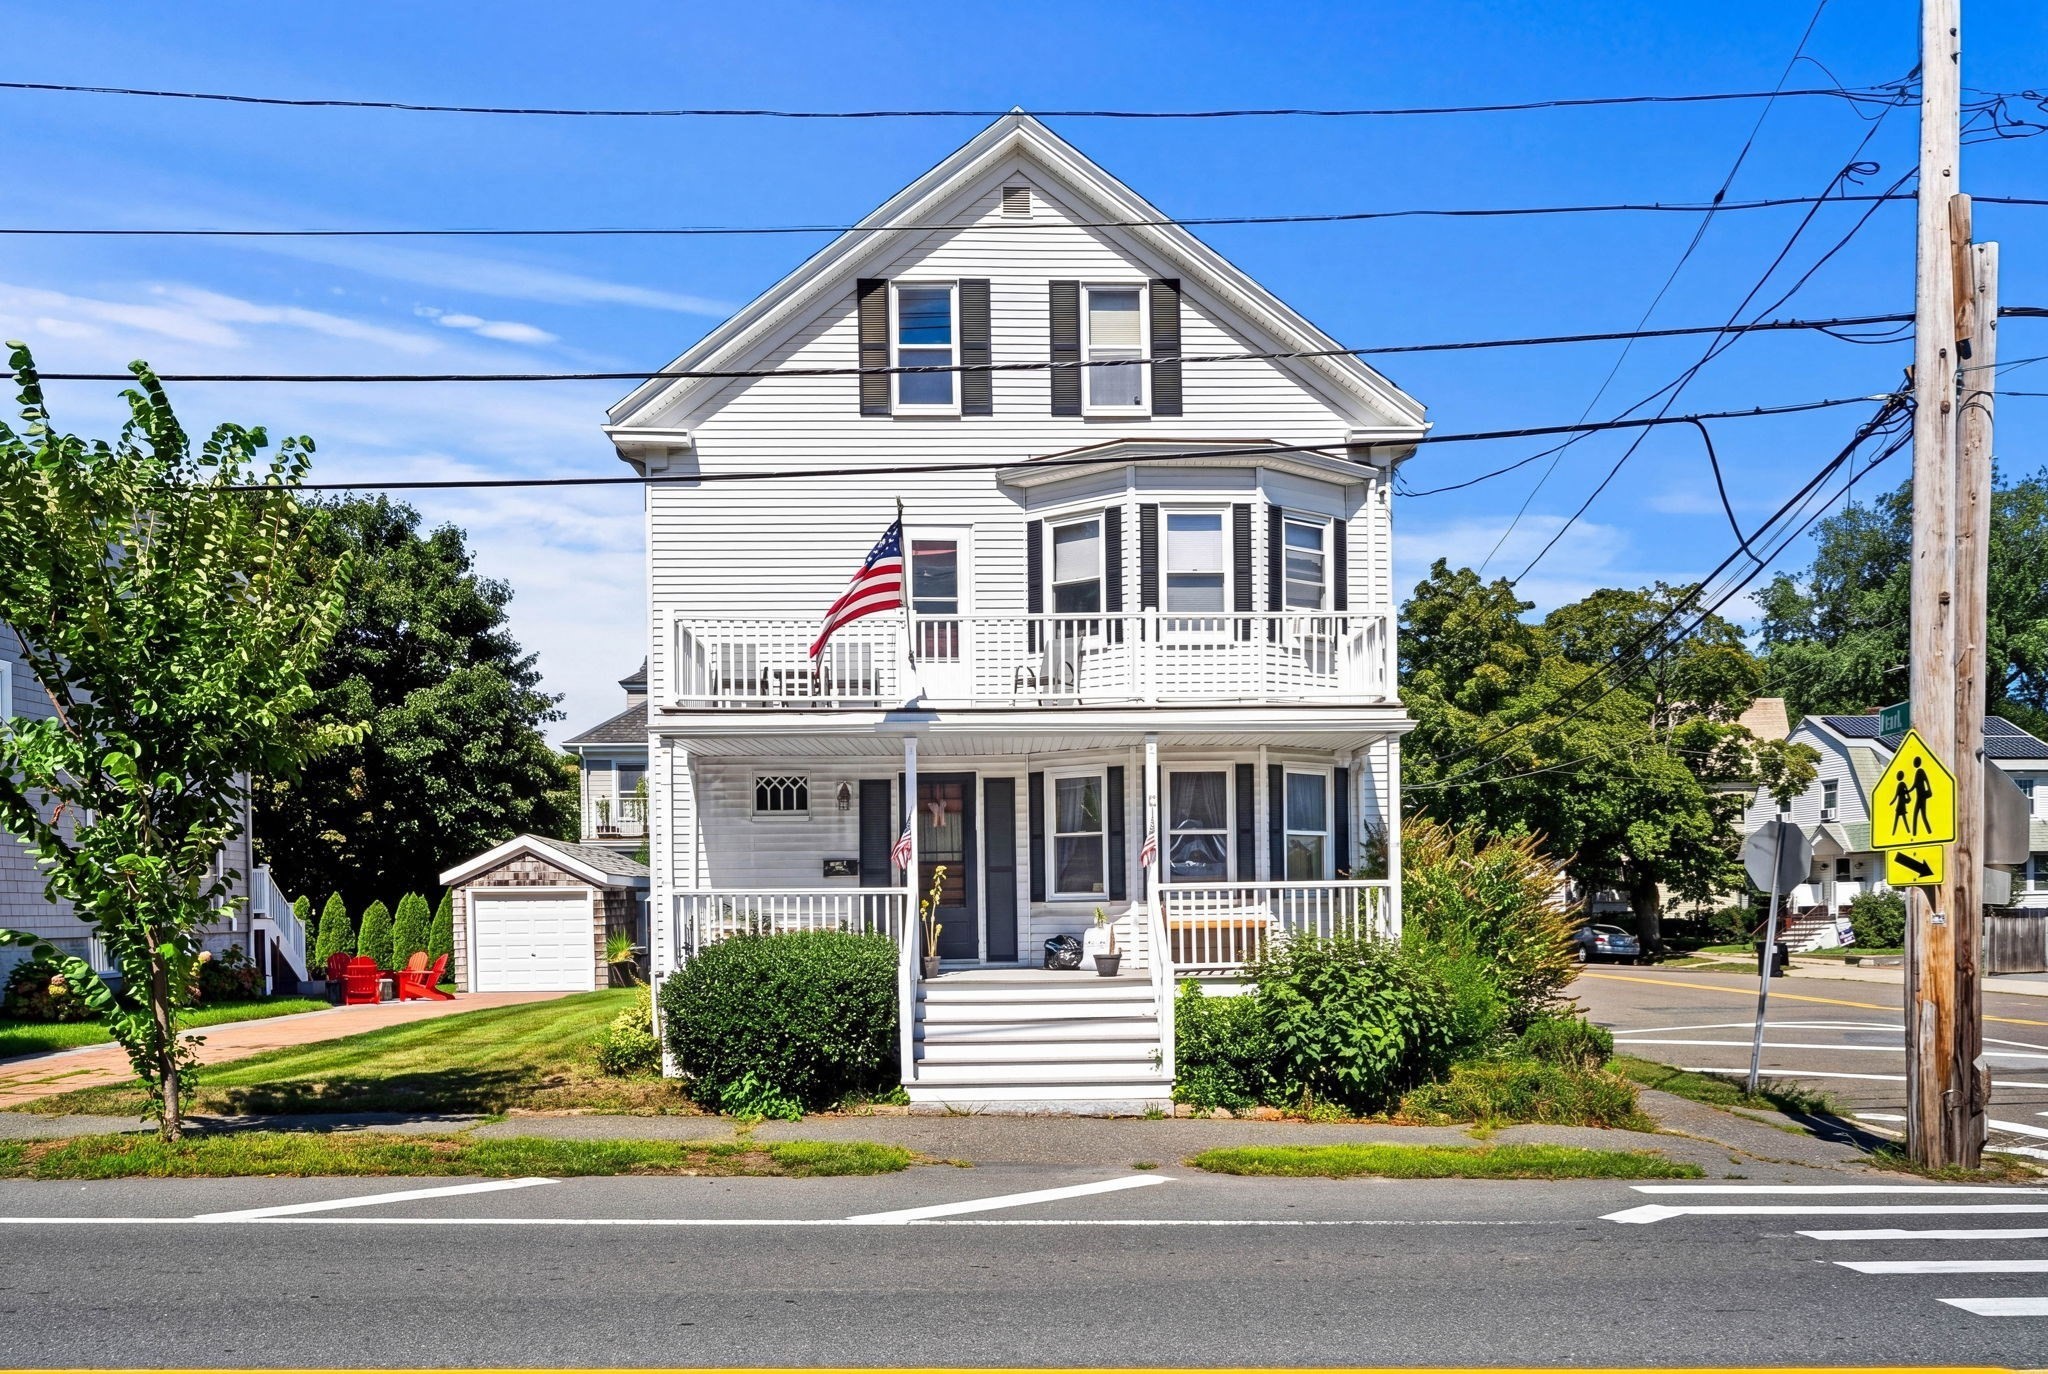
Ideally located just a short distance from vibrant downtown Salem, this well-maintained two-family offers a fantastic opportunity for both owner-occupants and investors. Lovingly cared for by the same family for many years, the property shows pride of ownership throughout and offers spacious, functional layouts with plenty of character. With three levels, the home also presents exciting potential for future…
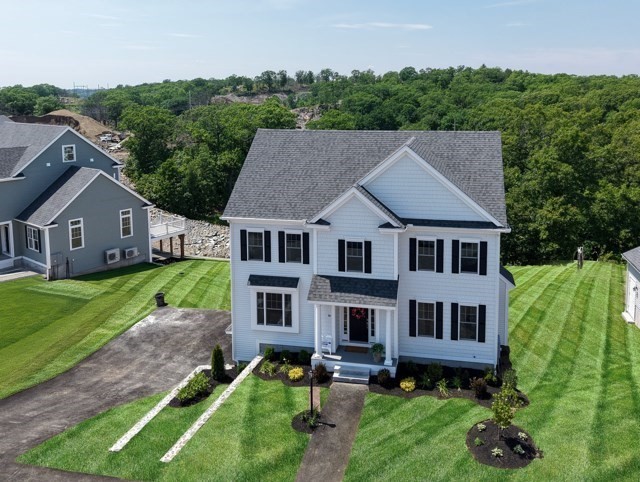
New Construction - Final Phase at Strongwater Crossing, Salems premier subdivision! Built by nationally award-winning DiBiase Companies, this beautifully designed, all-electric, high-efficiency home has everything you've been looking for! Offering 2295 Sq Ft of thoughtfully designed living space, the Derby model features 3 spacious bedrooms, 2.5 bathrooms, a flexible loft area and a 2-car garage complete with an EV…
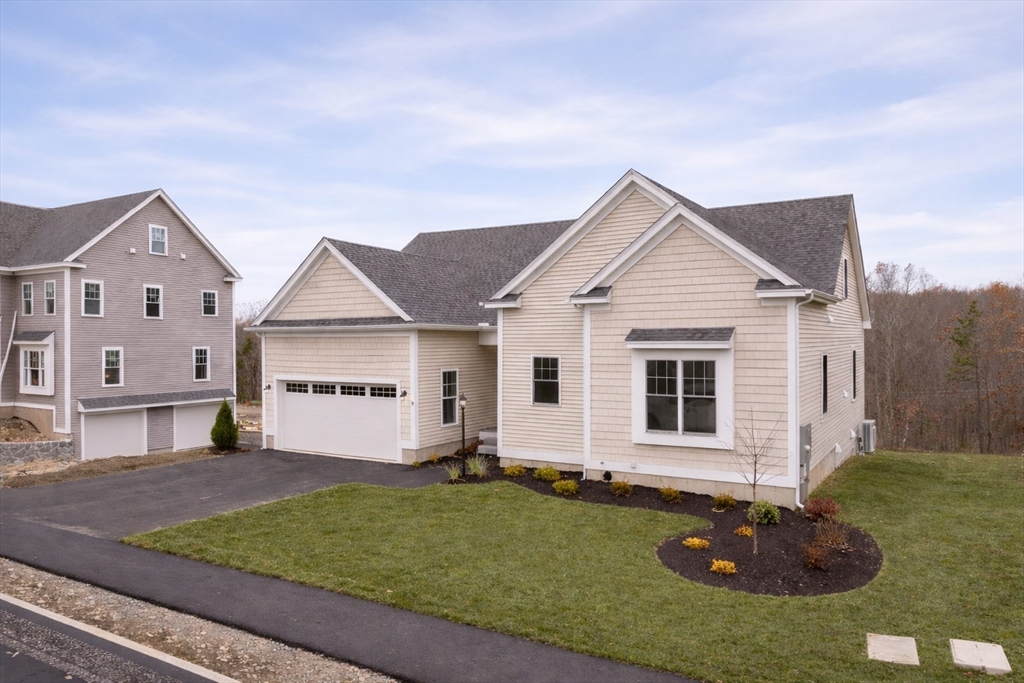
New Construction-Final Phase at Strongwater Crossing, Salems premier subdivision! Built by nationally award-winning DiBiase Companies, this beautifully designed, all-electric, high-efficiency home has everything you've been looking for! Offering over 1700 Sq Ft of thoughtfully designed living space all on one floor, the McIntire model features 3 spacious bedrooms, 2 bathrooms, a flexible loft area and an oversized…
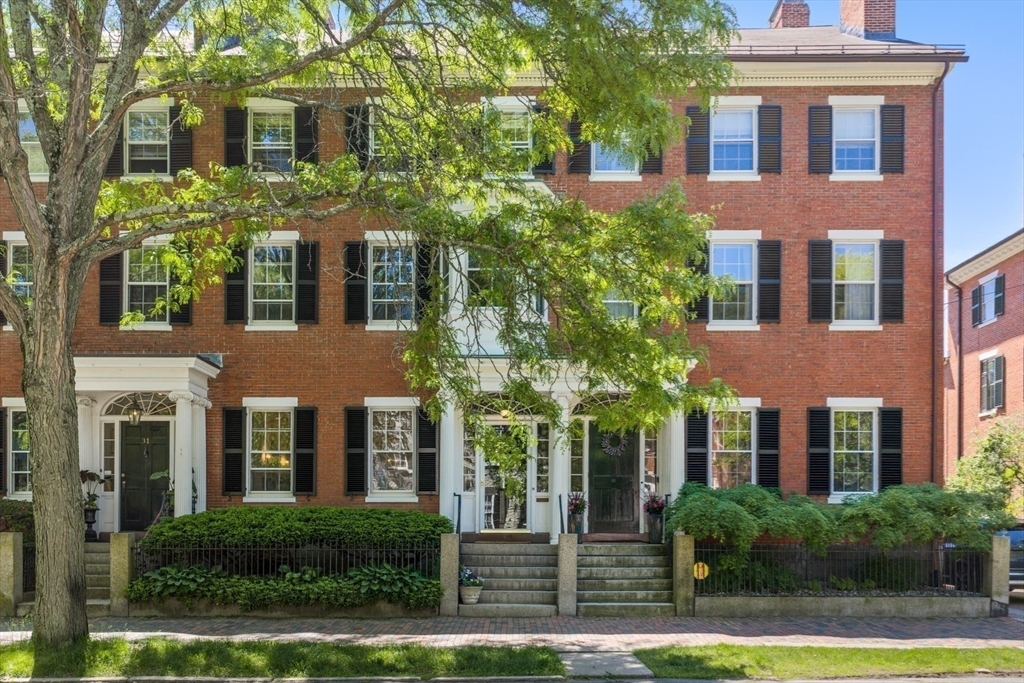
Grand Federal townhouse offering four floors of gracious living on Salem's celebrated Chestnut Street. Generously scaled living and dining rooms showcase original woodwork and elegant King of Prussia marble mantels. A pair of dramatic 9-foot doorways in the dining room open to a deck with steps to the garden below, creating seamless indoor-outdoor living. Reflecting the home's thoughtful design, a service kitchen on…
6 Beds • 4 Full Baths • 2 Half Baths • 4,670SF • Antique, Georgian
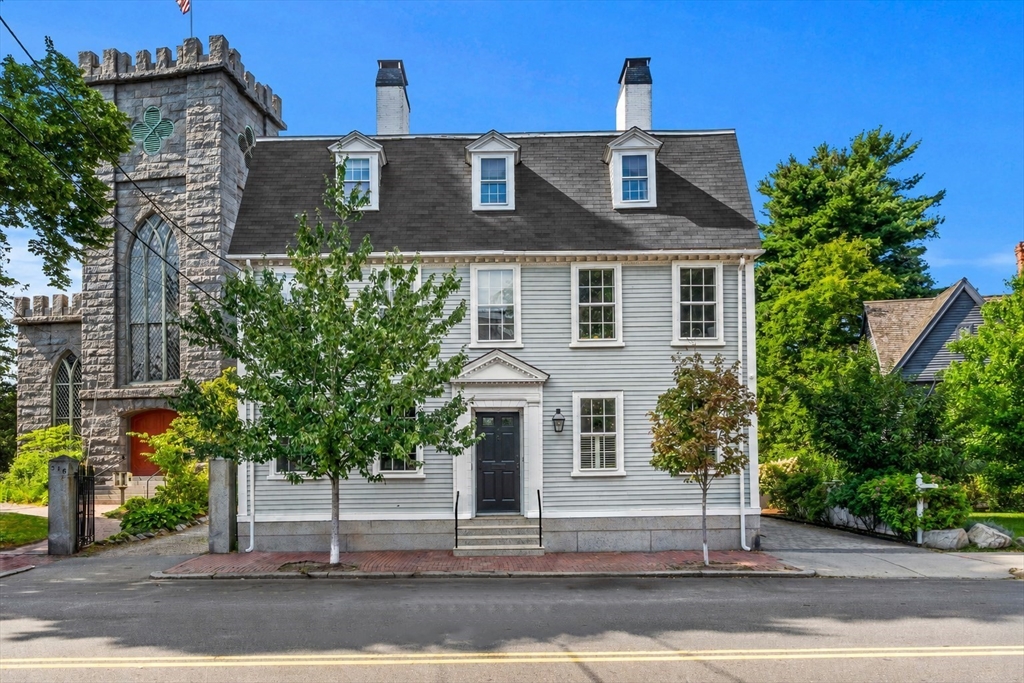
Older than America and standing directly beside Salem's iconic Witch House, the Lindall-Gibbs-Osgood House is a remarkable piece of New England history. Built c.1755, this Georgian-style gambrel offers 4,670 SF across three finished levels and was extensively restored and renovated in 2016, thoughtfully preserving original floors, fireplaces and centuries-old architectural details while introducing modern systems…
Kathy & Terry Sullivan help buyers navigate Salem, Marblehead, and communities throughout Boston’s North Shore. Whether you are comparing neighborhoods, evaluating property condition, or preparing an offer, the Sullivan Team can help you move from online search to an informed decision.
Listing information is based on the supplied MLS search export and may change. Buyers should verify current availability, price, property details, and other information before making a purchase decision. Courtesy MLS PIN.
Housing Report, July vs June 2026: National vs Essex County, MA 8/22/2026
National Housing Report (Homes and Condos): Prices and Unit Sales Fell
Unit sales fell -1.7% to 4.06 Million, median sale prices fell 1.5% to $434,100, Days On Market rose from 53 to 57. Active Listings rose +2.1% to 1.126 Million, Months of Inventory unchanged at 4.6 Months and 20% of Active Listings had price reductions. Homes sold for 99.1% of Asking Price.
National Bottom Line:
South and West continue to shift to buyer favorable markets as inventory surges with new-home construction. However, the Northeast and Midwest remain highly competitive due to low inventory as new construction lags and buyers are attracted to lower priced inland markets as mortgage interest rates remain elevated.
Essex County MA: July 2026 vs June 2026- Summer Cooldown, Elevated Interest rates!
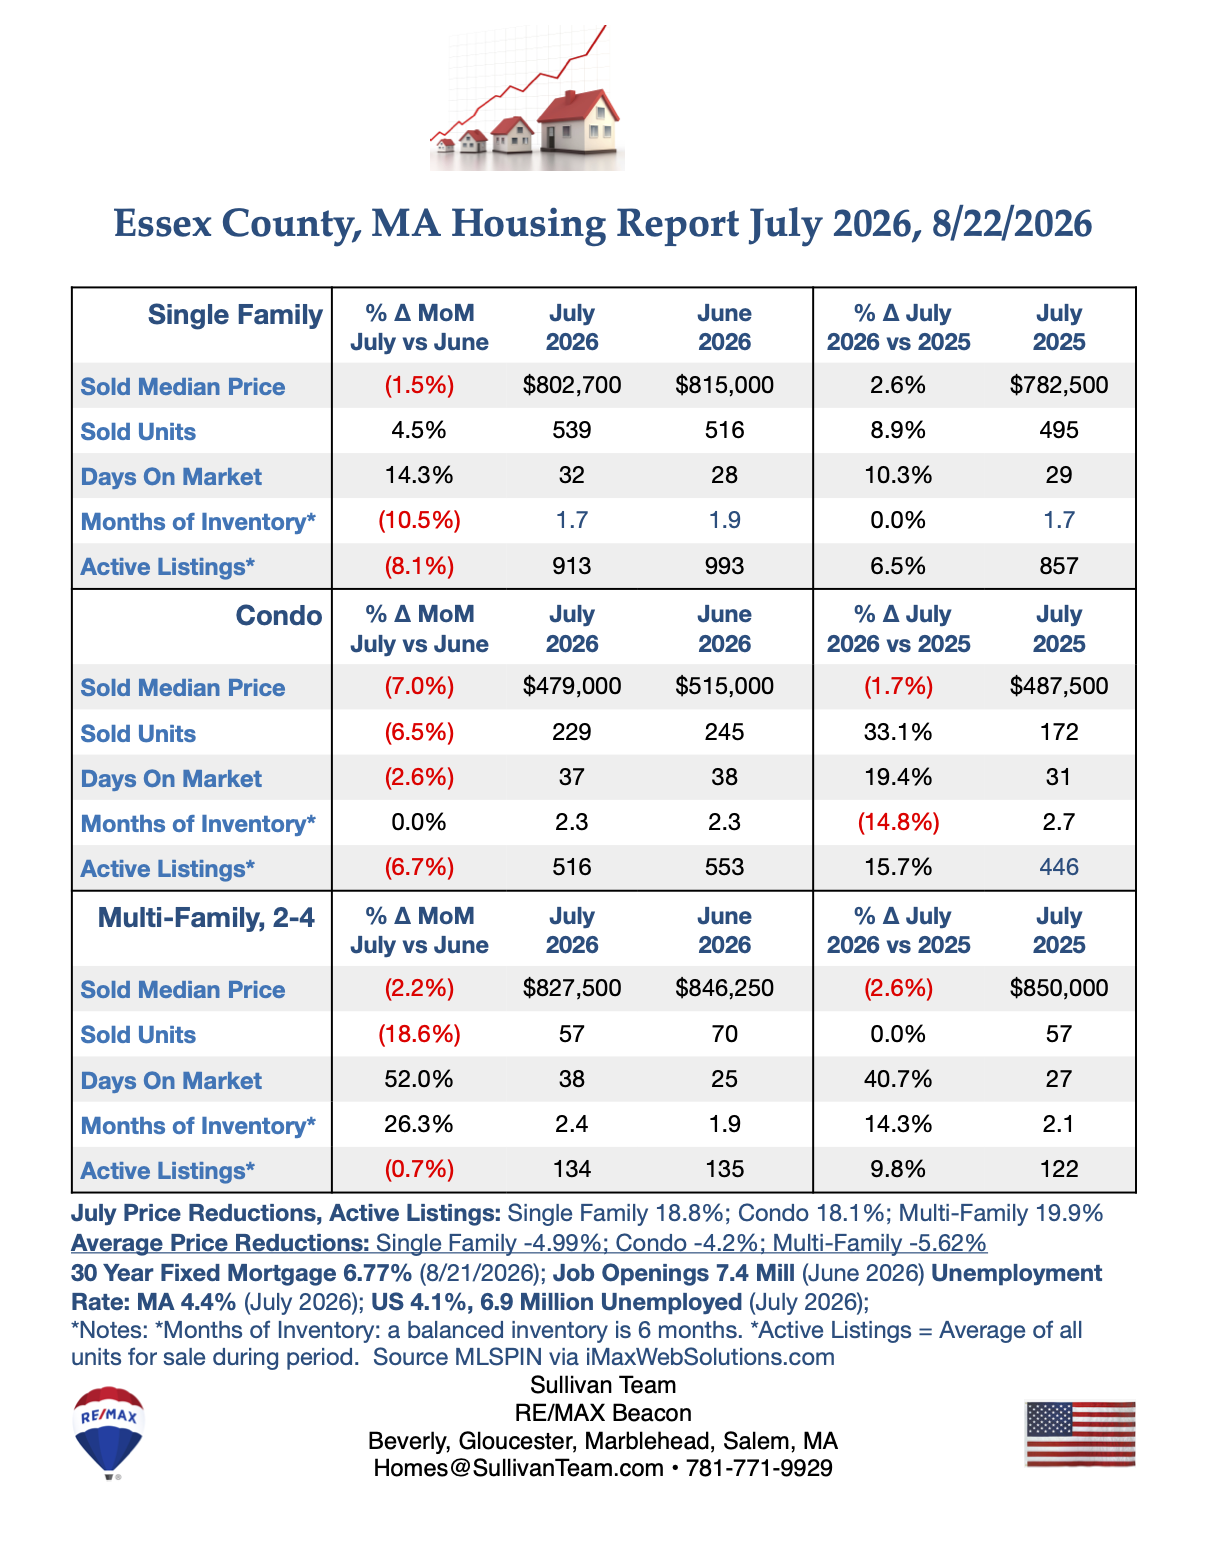
Month over month unit sales were mixed: Single Family up +4.5% to 539, Condos down -6.5% to 229 and 2-4 Multi-Families down -18.6% to 57. Median Sales Prices are down: Single Family -1.5% to $802,700, Condos -7.0% to $479,000 and Multi-Family -2.2% to $827,500. Days on Market were 32 for Single Family, 37 for Condos and 38 for Multi-Family.
Essex County MA: Median Sold Price to Median List Price Ratio - July 2026: Single Family Sold for 100%; Condo Sold for 93.0%; Multi-Family Sold for 94.8%.
Active Listings With Price Reductions - June 2026: 18.8% of Single-Family, 18.1% of Condos and 19.9% of 2-4 Unit Multi-Family had price reductions. The average Price Reductions were: Single-Family -4.99%; Condo -4.2%; Multi-Family -5.62%.
Current Months of Inventory - a balanced market has 6 months of inventory: Single-Family 1.7 months, Condo 2.3 months, 2-4 Unit Multi-Family 2.4 months.
Bottom line: Current low inventory favors sellers who price their properties correctly.
Housing Report June 2026 vs May 2026, National VS Essex County, MA 7/25/2026
National Housing Report (Homes and Condos) Unit sales fell -1.92% to 4.09 Million, median sale prices rose 2.63% to $440,600, Days On Market rose from 52 to 53. Active Listings rose +4.15% to 1.1 Million, Months of Inventory rose +2.2% to 4.6 Months and 18.8% of Active Listings had price reductions. Homes sold for 98.3% of Asking Price.
Bottom Line: South and West continue to shift to buyer favorable markets as inventory surges with new-home construction. However, the Northeast and Midwest remain highly competitive due to low inventory as new construction lags and buyers are attracted to lower priced inland markets.
Essex County - June 2026. vs May 2026 - Summer Starts Strong!
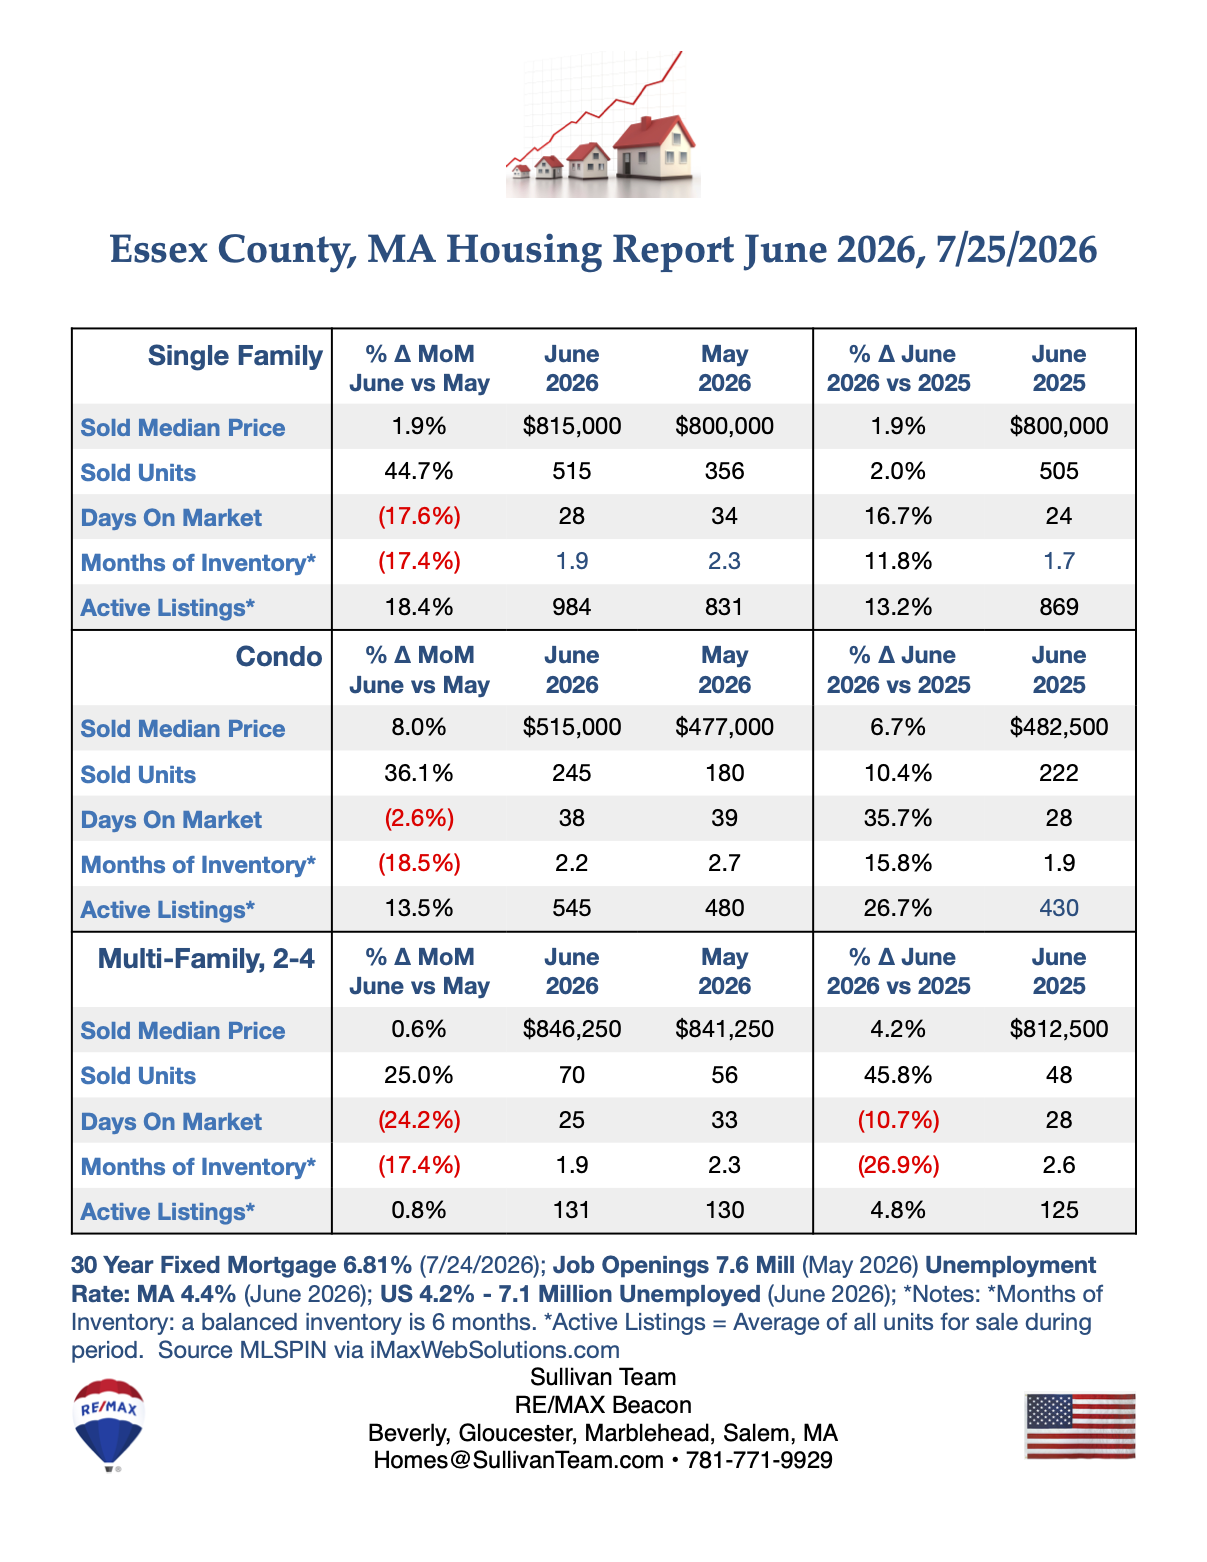
Month over month unit sales finished strong: Single Family up +44.7% to 515, Condos up +36.1% to 245 and 2-4 Multi-Families up +25.0% to 70. Median Sales Prices were up: Single Family up +1.9% to $815,000, Condos up +8.0% to $515,000 and Multi-Family up +0.6% to $846,250. Days on Market were 28 for Single Family, 38 for Condos and 25 for Multi-Family.
Median Sold Price to Median List Price Ratio - June 2026: Single Family Sold for 98.8%; Condo Sold for 99.2%; Multi-Family Sold for 96.7%.
Active Listings With Price Reductions - June 2026:19.4% of Single-Family, 18.1% of Condo and 14.7% of 2-4 Unit Multi-Family had price reductioins. The average Asking Price Reductions were: Single-Family -5.22%; Condo -4.59%; Multi-Family -5.10%.
Current Months of Inventory- a balanced market has 6 months of inventory: Single-Family 1.9 months, Condo 2.2 months, 2-4 Unit Multi-Family 1.9 months.
Bottom line:Current low inventory favors sellers who price their properties correctly.
North Shore Cape Ann Region Single-Family Sales Jumped 100% in Q2 from Q1
Welcome to the Cape Ann Region: Rugged Coastal Beauty & Vibrant Seaside Living
Extending into the Atlantic Ocean, the Cape Ann sub-region—encompassing Beverly, Gloucester, Rockport, Essex, and Manchester-by-the-Sea—is famous for its dramatic rocky coastlines, deep maritime history, thriving arts communities, and prime commuter connections. Emerging from the quieter winter months, Cape Ann experienced a massive seasonal surge in Q2 2026. Active listings more than doubled to 326 properties, fueling a 100% doubling in closed unit sales (128 homes sold in Q2 vs. 64 in Q1). Strong demand for an authentic coastal lifestyle pushed the regional median sales price up 10.4% quarter-over-quarter to $927,500 from $840,000 in Q1, with listings moving swiftly at an average of 36 days on market vs 74 in Q1 and months of inventory fell to 2.4 months from 3.9 months in Q1.
The Towns of Cape Ann: Market Info & Buyer Appeal
Beverly, MA
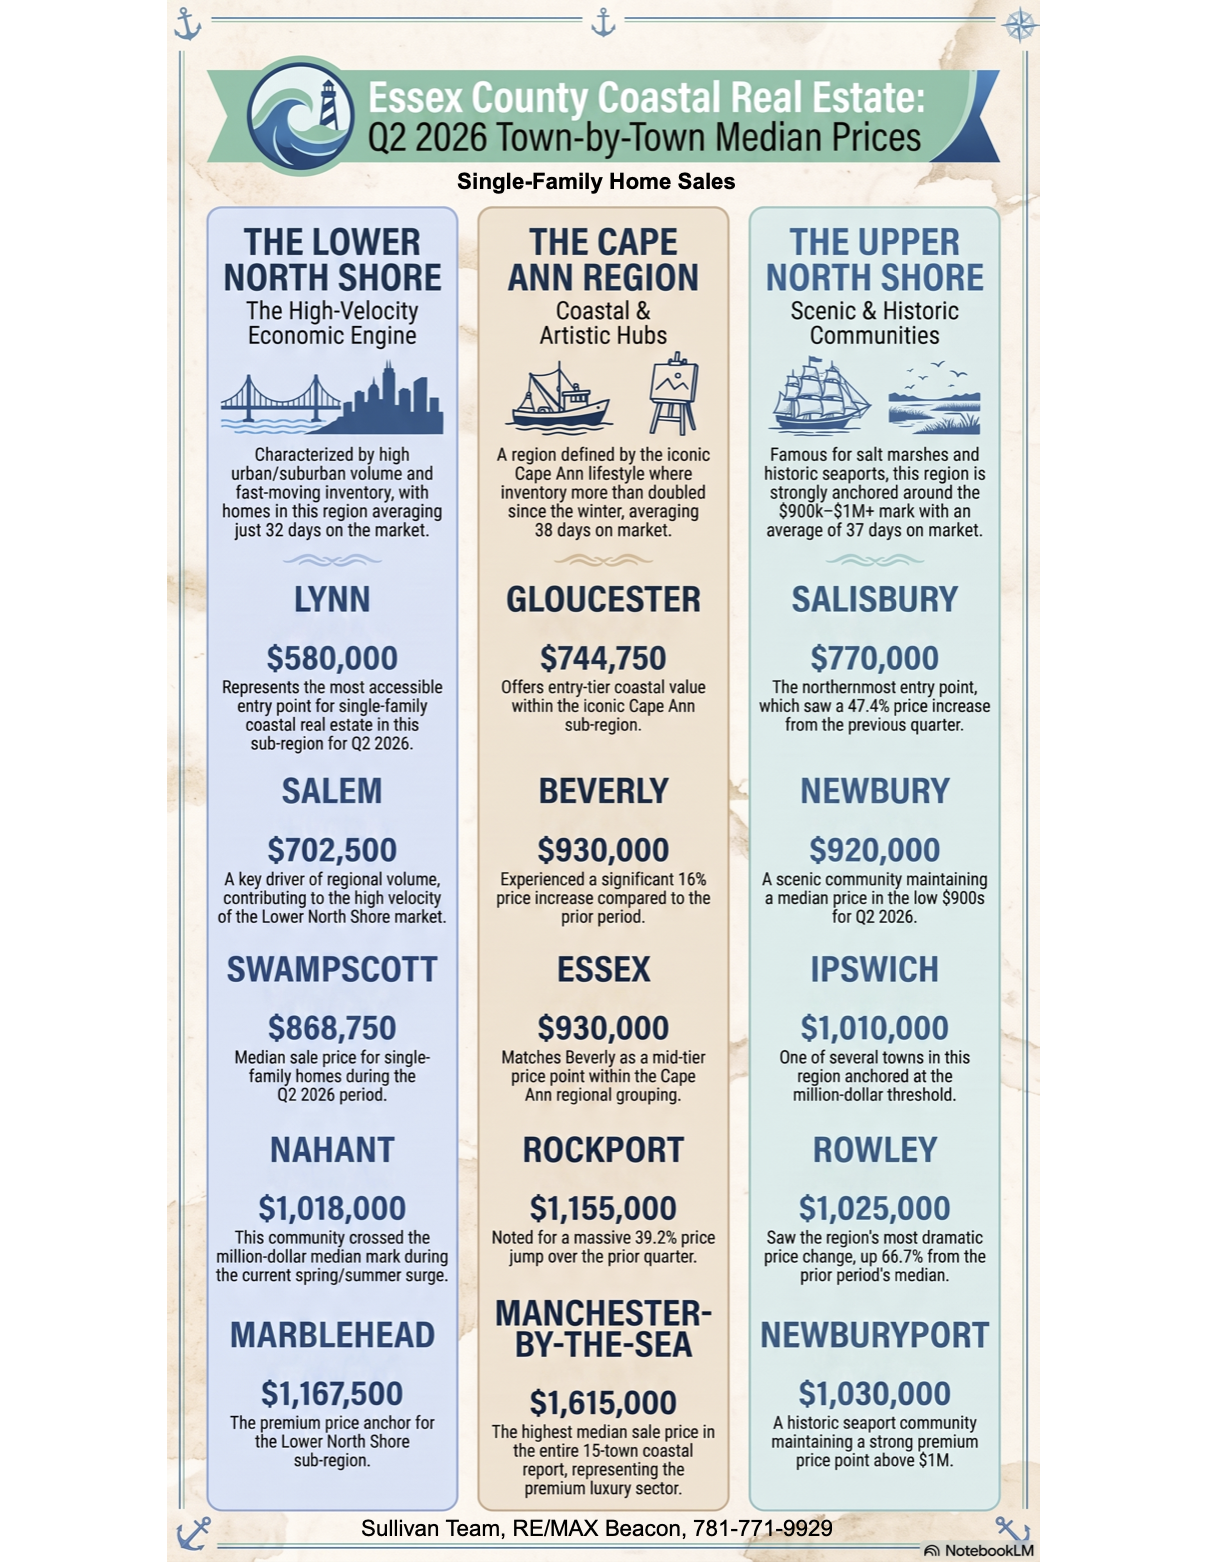
The Q2 2026 Stats: Median Price: $930,000 | Volume: 53 units sold | Average Days on Market: 35 days.
Why You Want to Move Here: Known affectionately as "The Garden City," Beverly seamlessly balances vibrant downtown energy with high-end, peaceful coastal living. Buyers choose Beverly for its five sandy beaches, thriving arts district, top-rated restaurants, and five MBTA commuter rail stops providing effortless access into Boston.
Gloucester, MA
The Q2 2026 Stats: Median Price: $744,750 | Volume: 38 units sold | Average Days on Market: 47 days.
Why You Want to Move Here: As America’s oldest working seaport, Gloucester offers unmatched, authentic coastal character and maritime pride. Homebuyers are drawn to its iconic sandy stretches (like Good Harbor and Wingaersheek beaches), bustling active harbor, historic artists' colonies, and diverse collection of waterfront properties.
Rockport, MA
The Q2 2026 Stats: Median Price: $930,000 | Volume: 13 units sold | Average Days on Market: 35 days.
Why You Want to Move Here: Positioned at the rocky tip of the Cape Ann peninsula, Rockport is a world-famous oceanfront village centered around Bearskin Neck, Motif No. 1, and Sandy Bay. Buyers fall in love with its quiet seaside pace, dramatic ocean vistas, walkable historic center, and direct commuter rail connectivity back to the city.
Essex, MA
The Q2 2026 Stats: Median Price: $1,155,000 | Volume: 12 units sold | Average Days on Market: 37 days.
Why You Want to Move Here: Essex is a charming, low-density riverfront town renowned for its rich shipbuilding heritage, vibrant antique shops, and world-famous clam shacks. Buyers are attracted to its scenic Essex River marshlands, private boating access, antique farmhouses, and tranquil rural atmosphere and excellent schools.
Manchester-by-the-Sea, MA
The Q2 2026 Stats: Median Price: $1,615,000 | Volume: 12 units sold | Average Days on Market: 40 days.
Why You Want to Move Here: Manchester-by-the-Sea represents luxury coastal living at its absolute finest, anchored by its famous "Singing Beach" and picturesque harbor. Buyers flock here for its prestigious school district, high-end architectural estates, private yacht clubs, and charming, intimate village center.
Navigating the Cape Ann Region with Kathy and Terry Sullivan
With inventory moving quickly and months of supply dropping sharply from 3.9 months down to a lean 2.4 months, securing a property or listing a home on Cape Ann requires strategic execution and bulletproof market positioning.
As the Sullivan Team, we bring a specialized, multi-layered advantage to your move:
Terry’s Analytical Precision & Risk Management: Drawing upon his academic background as an Economics Major, his MBA in Finance, and his extensive career as a Risk Manager, Terry leads our back-end valuation and due diligence. He performs detailed market trend analyses and comparable adjustments while auditing properties to evaluate coastal risk factors—such as flood zone designations, coastal exposure, and structural integrity.
Kathy’s Winning Client Strategies: Utilizing the rigorous market metrics and financial adjustments Terry uncovers, Kathy crafts winning, custom-tailored strategies for buyers and sellers. She translates complex market trends into clear, actionable advice, leading client negotiations and delivering effective marketing strategies that command top market value.
Whether you are looking to buy in Beverly's coastal neighborhoods or list an estate in Manchester-by-the-Sea, we ensure your next real estate transaction is smooth, protected, and successful.
Upper Shore Coastal Region Single-Family Sales Skyrocketed 141.7% in Q2 from Q1
Welcome to the Upper Coastal North Shore: Historic Charm & Vast Natural Splendor
The Upper Coastal North Shore is a breathtaking region where history, pristine nature, and coastal living harmoniously intersect. Defined by its sprawling salt marshes, historic seaports, and scenic protected landscapes, this sub-region comprises five distinct communities: Ipswich, Rowley, Newbury, Newburyport, and Salisbury. The Upper North Shore experienced incredible market activity in Q2 2026. Closed home sales skyrocketed by 141.7% (climbing to 116 units from 48 in Q1), while spring inventory drove the regional median home price up by 11.8% to $950,000 from $850,000 in Q1. Average Days on Market was 33 vs 53 in Q1 and Months of Inventory fell to 2.4 months from 3.9 in Q1.
The Towns of the Upper North Shore: Market Stats & Buyer Appeal
Salisbury, MA
The Q2 2026 Stats: Median Price: $770,000 | Volume Change: +11 units (17 sold vs. 6 in Q1) | Average Days on Market: 58 days.
Why You Want to Move Here: Salisbury offers a fun, classic beach town atmosphere combined with beautiful, open salt marshes. Buyers choose Salisbury for its 5 miles of sandy beaches, state reservation parkland, and accessible price point on the coastal New Hampshire border.
Newbury, MA
The Q2 2026 Stats: Median Price: $920,000 | Volume Change: +21 units (31 sold vs. 10 in Q1) | Average Days on Market: 27 days.
Why You Want to Move Here: Newbury captures quintessential coastal agricultural charm. Stretching across the mainland to the southern half of Plum Island, it appeals to buyers seeking diverse options—from historic farmhouses in Old Town to seaside cottages along the Parker River National Wildlife Refuge.
Ipswich, MA
The Q2 2026 Stats: Median Price: $1,010,000 | Volume Change: +14 units (27 sold vs. 13 in Q1) | Average Days on Market: 28 days.
Why You Want to Move Here: Home to the largest collection of preserved First Period historic homes in the nation, Ipswich is ideal for history and nature lovers. Residents enjoy exclusive access to Crane Beach and the miles of scenic trails across the historic Crane Estate.
Rowley, MA
The Q2 2026 Stats: Median Price: $1,025,000 | Volume Change: +7 units (10 sold vs. 3 in Q1) | Average Days on Market: 31 days.
Why You Want to Move Here: Rowley is a peaceful, picturesque community popular with buyers seeking acreage and modern suburban builds. It combines low tax rates and an MBTA Commuter Rail station with historic town common charm.
Newburyport, MA
The Q2 2026 Stats: Median Price: $1,030,000 | Volume Change: +15 units (31 sold vs. 16 in Q1) | Average Days on Market: 32 days.
Why You Want to Move Here: Newburyport is a vibrant, highly walkable coastal city rich with maritime heritage. Buyers love its brick downtown, luxury boutiques, fine dining, and active marinas along the Merrimack River.
Navigating the Upper North Shore Region with Kathy and Terry Sullivan
With properties selling at a rapid pace of 33 average days on market and inventory levels dropping to 2.4 months in Q2, navigating the Upper North Shore demands a strategic, protective approach.
As the Sullivan Team, we guide you through every step of the transaction:
Terry’s Analytical Precision & Risk Management: Leveraging his studies as an Economics Major, his MBA in Finance, and his background as a Risk Manager, Terry leads the back-end due diligence. He creates detailed market trend analyses and adjustments for comparable properties while auditing property liabilities to keep your financial position secure.
Kathy’s Winning Client Strategies: Utilizing Terry's deep-dive data and trend metrics, Kathy builds winning strategies tailored specifically to your buying or selling goals. She leads client communications, crafts compelling offer strategies, and designs market-leading marketing plans that produce results.
Whether you're purchasing on Plum Island or listing in historic Ipswich, Terry and Kathy Sullivan provide the analytical authority and strategic representation you need to achieve your goals.
Lower Coastal North Shore Region Single-Family Sales Surge 66.9% in Q2 vs Q1
Welcome to the Lower Coastal North Shore: High Velocity & Coastal Energy
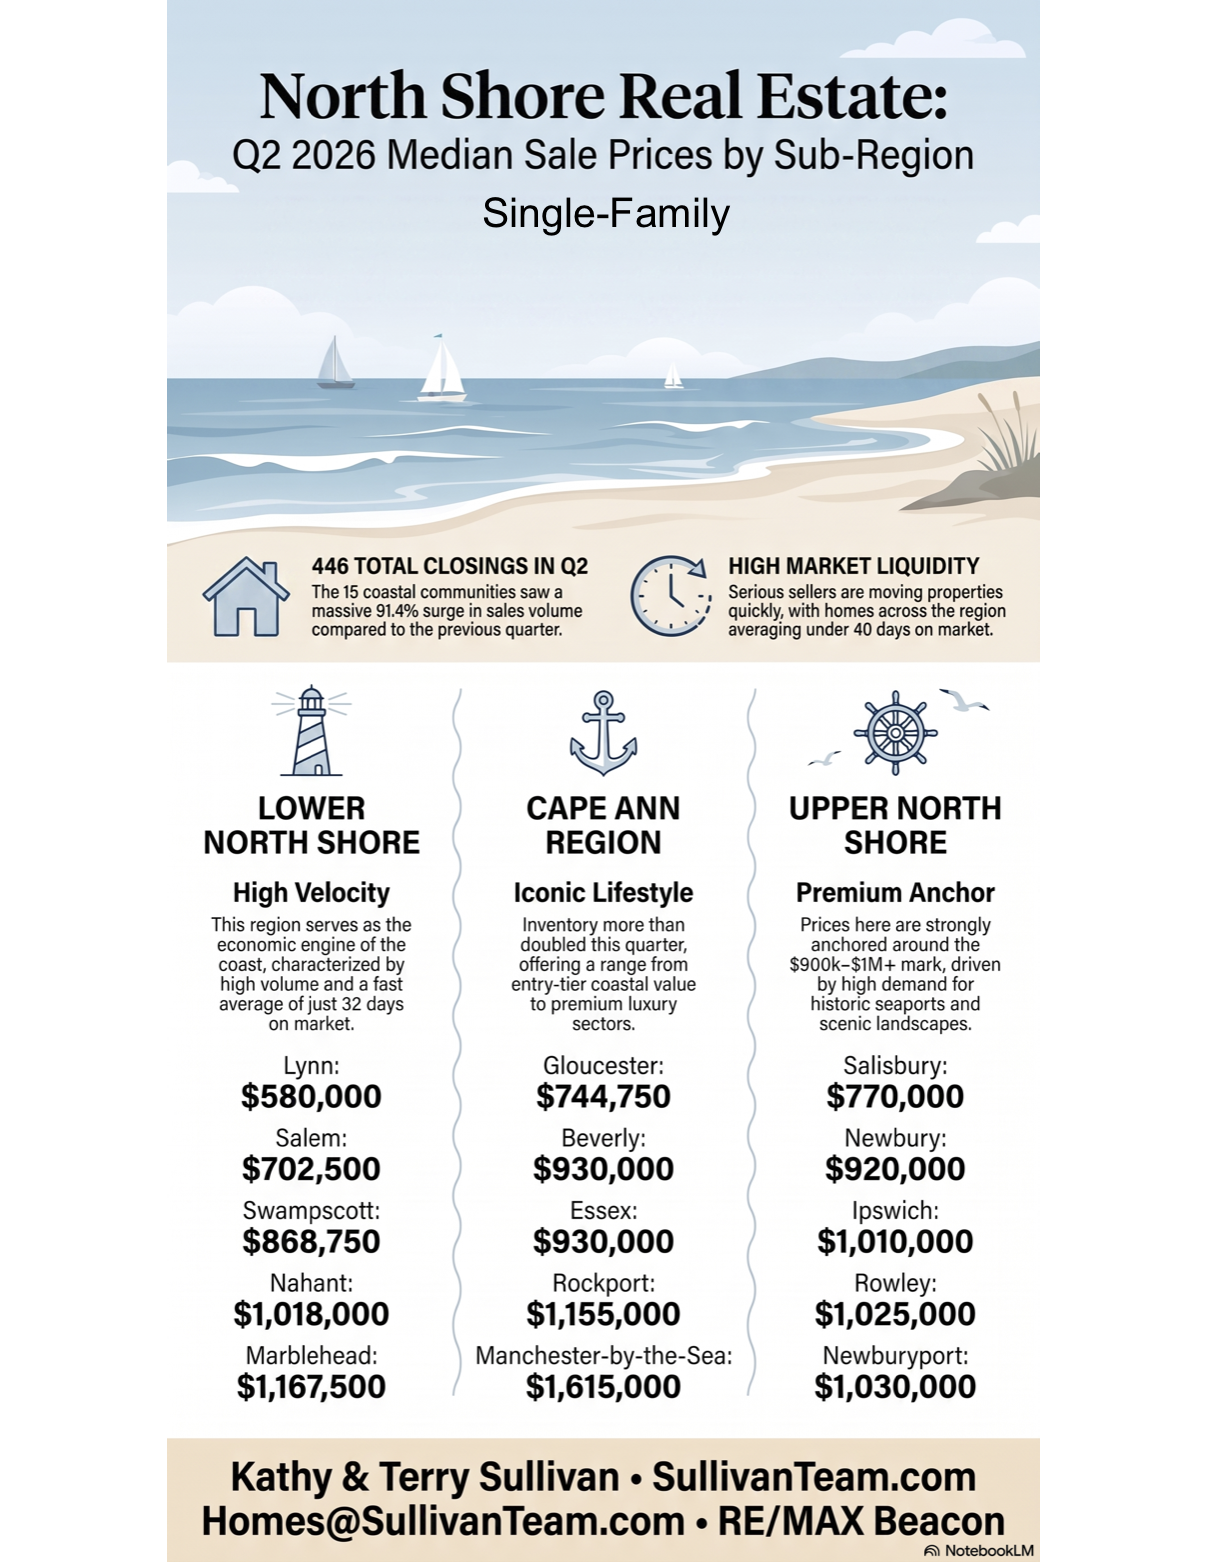
Positioned closest to Boston, the Lower Coastal North Shore—comprising Lynn, Nahant, Swampscott, Marblehead, and Salem—serves as the vibrant, high-velocity economic engine of the Essex County coast. Driven by a desire for oceanfront living, historic architecture, and effortless commuting option, buyers poured into this region during Q2 2026. Unit sales surged 66.9% (to 202 homes sold in Q2 vs. 121 in Q1) but median prices remained stable rising only 0.7% to $694,500 from $690,000 in Q1 while inventory tightened to a lean 1.8 months vs 2.1 months in Q1. Averaging just 35 days on market vs 38 in Q1, the Lower North Shore is a fast-moving, highly competitive arena where strategic timing and immediate action are paramount.
The Towns of the Lower North Shore: Market Info & Buyer Appeal
Lynn, MA
The Q2 2026 Stats: Median Price: $580,000 | Volume Change: +38 units (88 sold vs. 50 in Q1) | Average Days on Market: 38 days.
Why You Want to Move Here: Lynn offers the most accessible price point along the coast without compromising on urban convenience or scenic beauty. Buyers love its burgeoning downtown arts district, its direct commute to Boston via rail or ferry, the stately coastal homes in the Diamond District, and the sprawling 2,200-acre Lynn Woods Reservation.
Salem, MA
The Q2 2026 Stats: Median Price: $702,500 | Volume Change: +14 units (40 sold vs. 26 in Q1) | Average Days on Market: 30 days.
Why You Want to Move Here: Salem delivers world-class culture, rich maritime history, and an incredibly walkable, vibrant city core. Homebuyers are drawn to its Federal-style architecture, world-renowned museums, incredible restaurant scene, and direct commuter rail access, making it a energetic destination for work and play.
Swampscott, MA
The Q2 2026 Stats: Median Price: $868,750 | Volume Change: +6 units (27 sold vs. 21 in Q1) | Average Days on Market: 35 days.
Why You Want to Move Here: Swampscott is a quintessential seaside village known for its top-rated school system and close-knit community atmosphere. Buyers flock here for its sandy town beaches (like Eisman's and Fisherman's), beautiful oceanfront parks, and classic neighborhood charm located just minutes down the rail line from Boston.
Nahant, MA
The Q2 2026 Stats: Median Price: $1,018,000 | Volume Change: +5 units (5 sold vs. 0 in Q1).
Why You Want to Move Here: Connected to the mainland by a scenic causeway, Nahant is an exclusive, island-like peninsula community. Buyers choose Nahant for its hidden-gem privacy, sweeping 360-degree ocean views, historic coastal homes, and small-town tranquility that feels worlds away from the city hustle.
Marblehead, MA
The Q2 2026 Stats: Median Price: $1,167,500 | Volume Change: +18 units (42 sold vs. 24 in Q1) | Average Days on Market: 23 days.
Why You Want to Move Here: Renowned as the yachting capital of America, Marblehead is a premier luxury destination. Buyers are captivated by its historic 18th-century Old Town, bustling harbor views, exceptional schools, and deeply rooted maritime heritage that commands lasting property equity.
Navigating the Lower North Shore Region with Kathy and Terry Sullivan
With inventory standing at a tight 1.8 months and desirable homes going under contract in as little as 23 to 30 days, navigating the Lower North Shore requires sharp market intelligence and a proactive defensive strategy.
As the Sullivan Team, we bring a unique, two-pronged advantage to your real estate journey:
Terry’s Analytical Precision & Risk Management: Terry draws upon his background as an Economics Major, his MBA in Finance, and his years of experience as a Risk Manager to conduct detailed market trend analyses and comparable property adjustments. He evaluates local market variables while thoroughly auditing properties to uncover latent liabilities (such as flood zones or structural concerns) before you ever sign a contract.
Kathy’s Winning Client Strategies: Utilizing the rigorous data, financial trend analyses, and adjustments Terry uncovers, Kathy craftswinning, custom-tailored strategies for buyers and sellers alike. She translates complex market metrics into clear, actionable advice, leading high-stakes negotiations and executing effective marketing strategies to maximize your results.
Whether you are looking to buy a historic home in Marblehead, list a commuter-friendly property in Salem, or invest in Lynn's expanding market, we ensure you move with total confidence, clarity, and protection. Let’s connect and map out your next coastal move!
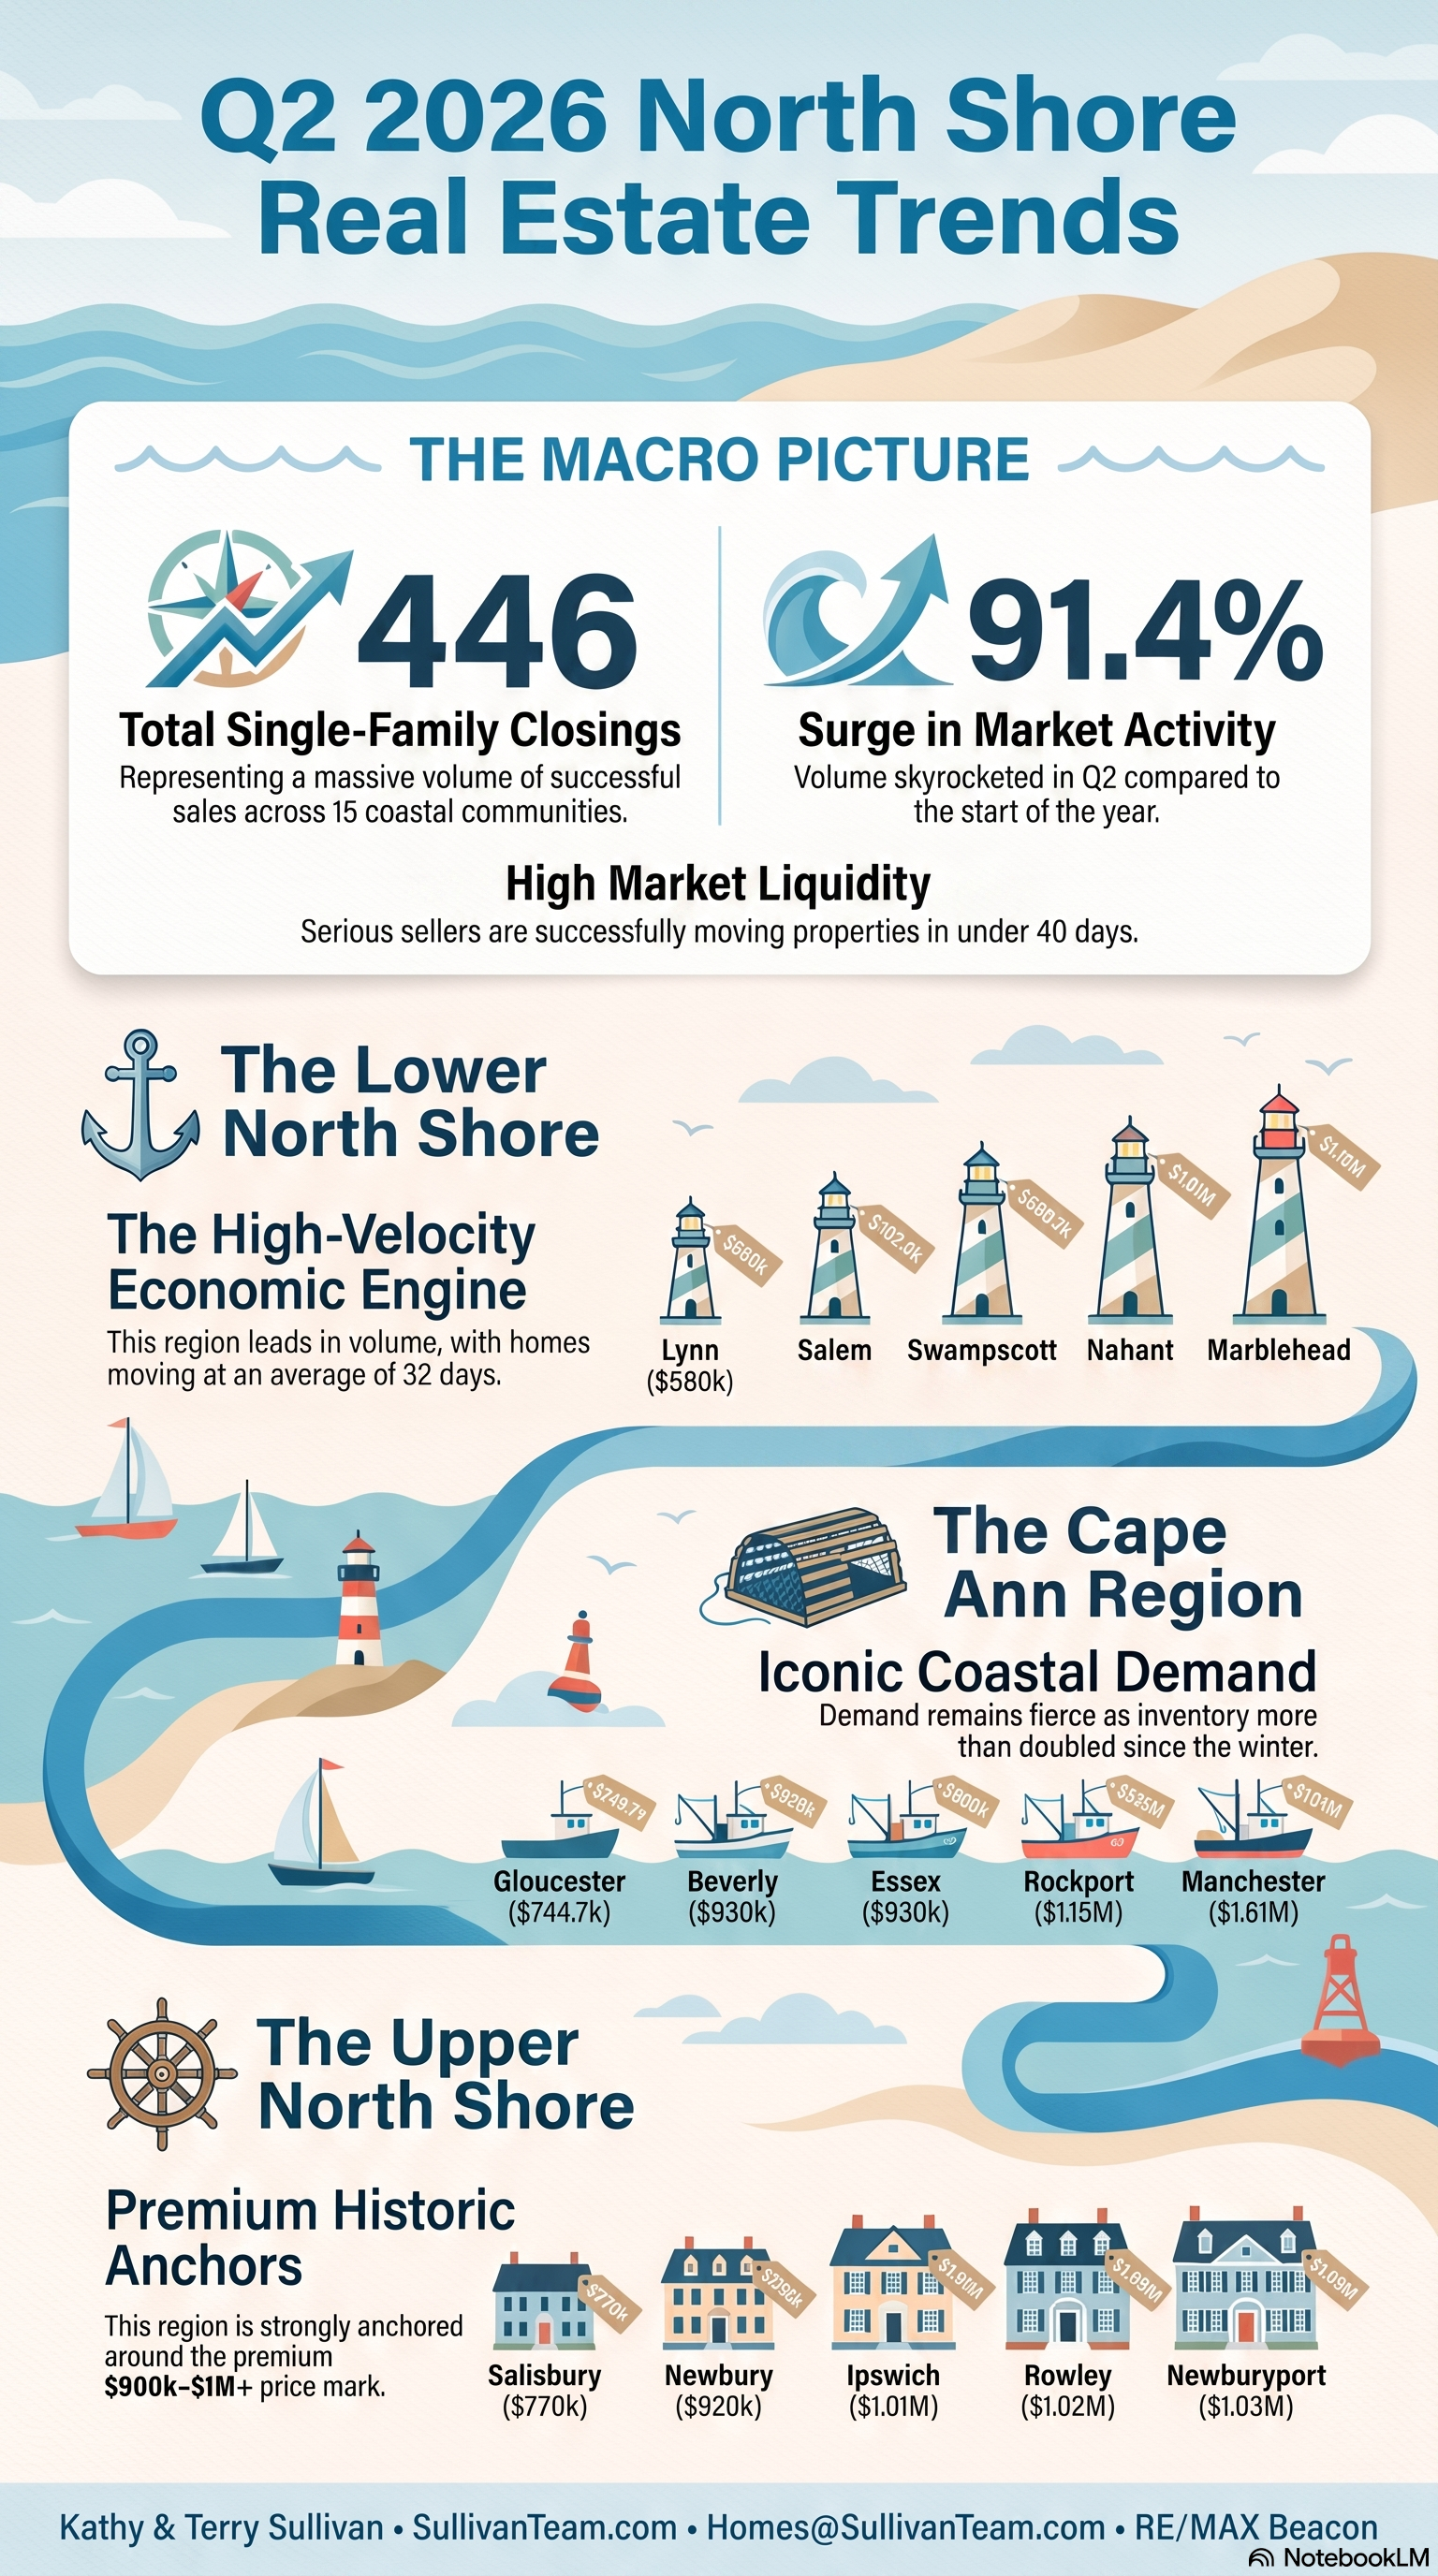
The Macro Picture: Q2 vs Q1 for 15 North Shore Coastal Towns
Home Sales surge 91.4% to 446 units in Q2 vs 233 units in Q1; Median Prices
rose 2.5% to $815,000, and Average Days on Market was 35. Months of Inventory fell from 2.7 months in Q1 to 2.2 Months in Q2. Homes with price Reductions rose from 15.2% in Q1 to 22.6% in Q2.
1. The Lower North Shore:
5 Communities
(Lynn, Nahant, Swampscott, Marblehead, Salem)
Unit Sales Rose 66.9% to 202 Homes in Q2 vs 121 in Q1; Median Prices rose 0.7% to $694,500; Average 35 Days on Market; Town Median Prices Ranged from $580,000 for Lynn to $1,167,500 for Marblehead; Months of Inventory fell to 1.8 Months in Q2 from 2.1 months in Q1.
The Story: This region represents the high-velocity economic engine of the coast.
Unit Sales rose 100% to 128 Homes in Q2 vs 64 in Q1; Median Prices rose 10.4% to $927,500; Average 36 Days on Market; Town Median Prices Ranged from $744,750 for Gloucester to $1,615,000 for Manchester; Months of Inventory fell to 2.4 Months in Q2 from 3.9 months in Q1.
The Story: Demand for the iconic Cape Ann lifestyle remains fierce; Active Listings more than doubled to 326 since Q1.
Unit Sales rose 141.7% to 116 Homes in Q2 vs 48 in Q1; Median Prices rose 11.8% to $950,000; Average 33 Days on Market; Town Median Price Ranged from $770,000 for Salisbury to $1,030,000 for Newburyport; Months of Inventory fell to 2.4 Months in Q2 from 3.9 months in Q1.
The Story: This region is famous for its historic seaports, sprawling salt marshes, and scenic landscapes.
Welcome to the Cape Ann Region: Iconic Coastal Living
There is something genuinely magical about the Cape Ann Region. Defined by its rugged, rocky granite coastlines, deep-rooted seafaring history, and pristine sandy shores, this sub-region represents the quintessential New England lifestyle. Emerging from the winter market, Cape Ann experienced an incredible seasonal surge in Q2 2026. Active listings more than doubled to 326 properties, fueling a 100% double-digit explosion in closed unit sales (128 homes sold in Q2 vs. just 64 in Q1). Driven by fierce lifestyle demand, the regional median sales price climbed 10.4% over the previous quarter to $927,500, with homes moving swiftly off the market at an average of 36 days.
If you are looking to purchase a piece of the classic Massachusetts coast, Cape Ann offers distinct communities that cater to every definition of "home."
The Towns of Cape Ann: Q2 2026 Market Stats & Lifestyle Appeal
Beverly, MA
The Q2 2026 Statistics: 53 Units Sold | $930,000 Median Sale Price | 35 Average Days on Market
Why You Want to Move Here: Known affectionately as "The Garden City," Beverly perfectly balances vibrant, transit-oriented downtown convenience with high-end, quiet coastal neighborhoods. With multiple commuter rail stops and the gorgeous public beaches of Beverly Cove, it's a dream location for professionals who want immediate access to upscale restaurants, a thriving local theater scene, and effortless water access.
Gloucester, MA
The Q2 2026 Statistics: 38 Units Sold | $744,750 Median Sale Price | 47 Average Days on Market
Why You Want to Move Here: As America's oldest working seaport, Gloucester offers an unmatched, authentic coastal grit and maritime pride. It boasts some of the most spectacular natural white-sand beaches in New England—Good Harbor and Wingaersheek. If your goal is to live a lifestyle directly connected to boating, deep-sea fishing, whale watching, and fresh dock-to-table seafood, Gloucester delivers an active waterfront community at a highly competitive regional value.
Rockport, MA
The Q2 2026 Statistics: 12 Units Sold | $1,155,000 Median Sale Price | 37 Average Days on Market
Why You Want to Move Here: Situated at the absolute tip of Cape Ann, Rockport is the epitome of picturesque charm. Home to the world-renowned Bearskin Neck art colony and the iconic "Motif #1" fishing shack, this town is built for those seeking creative inspiration, serenity, and striking shingle-style coastal architecture. It is a peaceful coastal haven where the pace slows down and the views open up.
Essex, MA
The Q2 2026 Statistics: 13 Units Sold | $930,000 Median Sale Price | 35 Average Days on Market
Why You Want to Move Here: If your dream is coastal living combined with rural privacy, open acreage, and classic New England history, Essex is your destination. Widely celebrated as America’s antique capital, this quiet town trades immediate ocean waves for winding rivers, expansive salt marshes, and beautiful wooded landscapes. It’s perfect for buyers seeking private estates, kayaking on the Essex River, and a cozy, small-town community.
Manchester-by-the-Sea, MA
The Q2 2026 Statistics: 12 Units Sold | $1,615,000 Median Sale Price | 40 Average Days on Market
Why You Want to Move Here: As the premier luxury anchor of the Cape Ann region, Manchester-by-the-Sea represents the peak of exclusive North Shore real estate. Home to the legendary, musical sands of Singing Beach, pristine private yacht clubs, and an elite regional school system, it draws buyers looking for historic, winding estate paths, exceptional privacy, and a highly prestigious neighborhood environment.
Navigating Cape Ann with Kathy & Terry Sullivan
With months of inventory dropping sharply from 3.9 months down to a lean 2.4 months this quarter, Cape Ann is a fast-moving, competitive market where timing and strategy mean everything. Navigating this coastal terrain requires a specialized hand—and that’s where we come in.
When you partner with Kathy and Terry Sullivan, you aren't just getting real estate agents; you are gaining a dedicated team with a comprehensive business, risk management, and local market analysis background.
Kathy Sullivan brings a meticulous, highly organized approach to contract preparation and strategy execution. She ensures your offer stands out in multi-offer situations, giving listing agents and sellers a seamless package they cannot refuse.
Terry Sullivan utilizes his extensive risk management background to expose latent liabilities, analyze property values thoroughly, and protect your investments from costly mistakes.
Together, we use detailed MLS market intelligence reports to track real-time price corrections, inventory velocity, and structural opportunities—guiding you safely home to Cape Ann.