


Essex County Annual Housing Report 1/23/2021 - Covid 19
For the comparative years: 2018 vs 2019 and 2019 vs 2020:
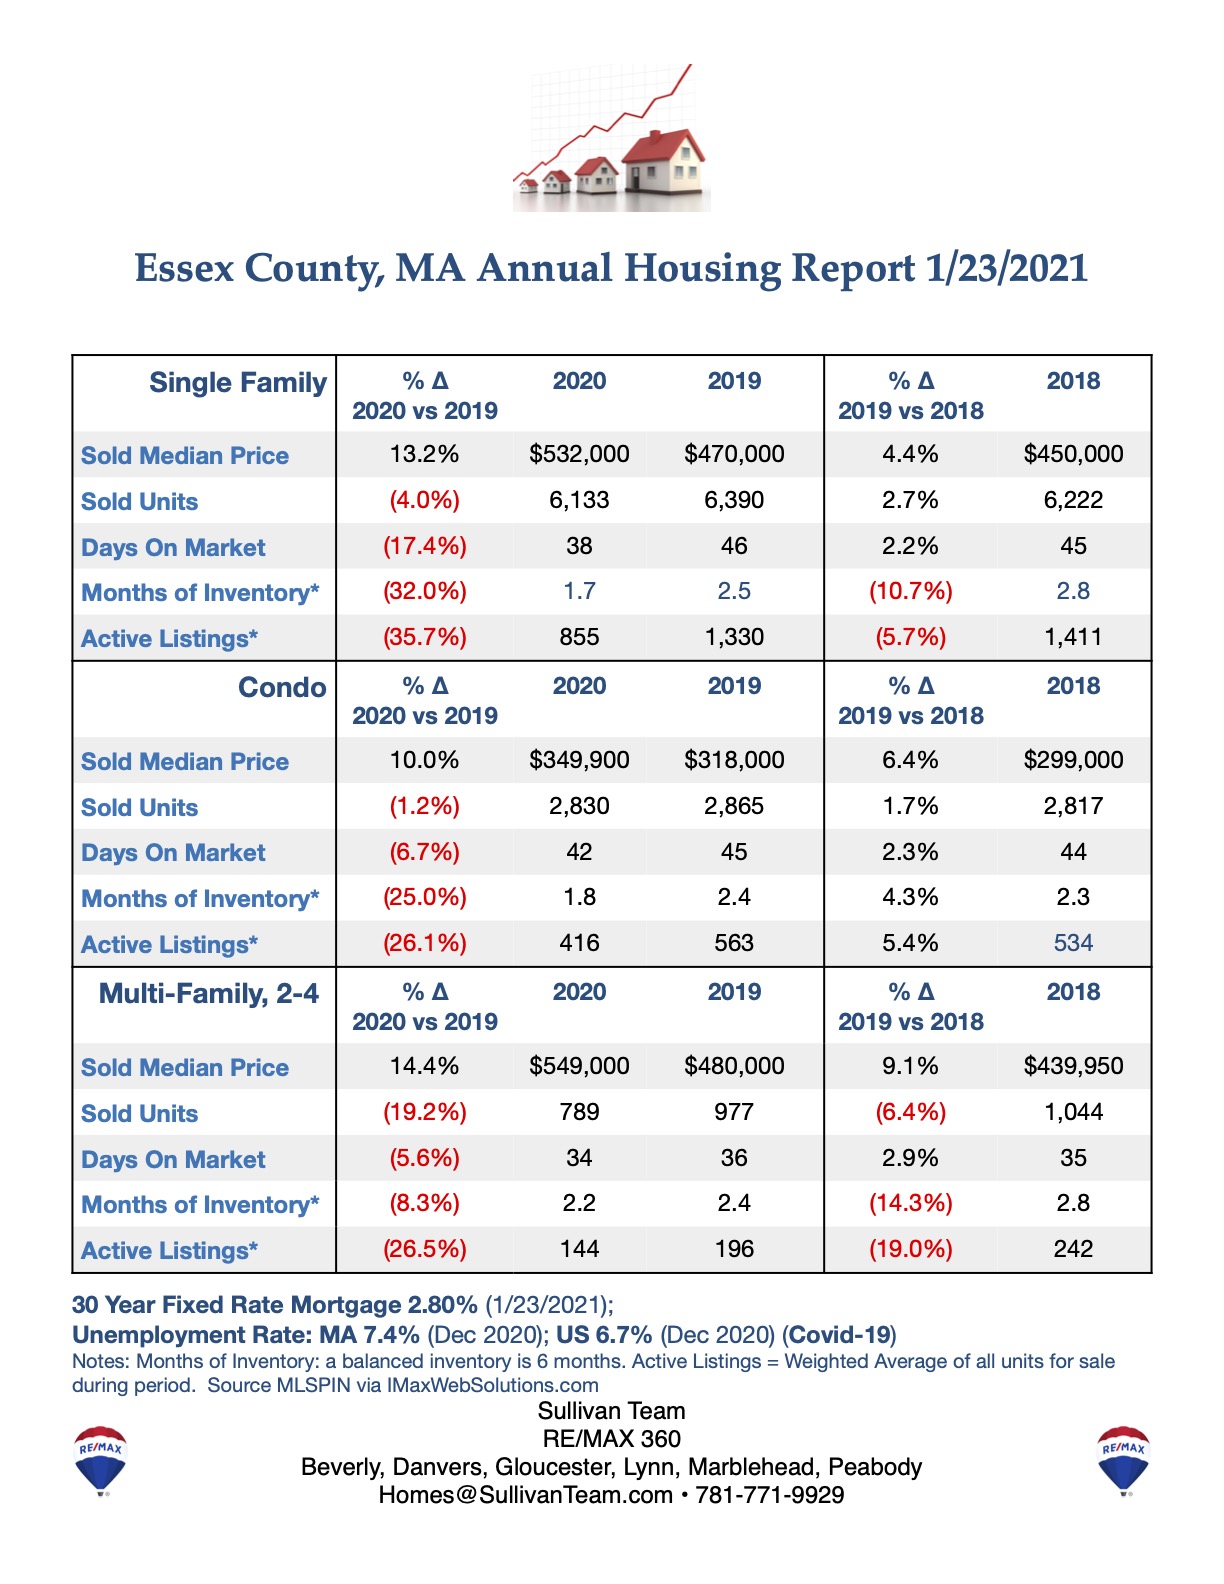
Median Sales Prices rose at an accelerated pace
2018 vs 2019, Median Sales Prices Rose:
+4.4% for Singles; +6.4% for Condos and +9.1% for 2-4 Units
2019 vs 2020, Median Sales Prices Rose:
+13.2% for Singles; +10% for Condos and 14.4% for 2-4 Units
The Number of Active Listings declined:
2018 vs 2019, Change in Number of Active Listings (weighted average):
-5.7% Singles; +5.4% Condos and -19% for 2-4 Units
2019 vs 2020, Change in Number of Active Listings (weighted average):
-35.7% Singles; -26.1% Condos and -26.5% for 2-4 Units
Months of Inventory Fell (6 months is a balanced market):
2018 vs 2019, Change in Months of Inventory:
-10.7% to 2.5 months for Singles; + 4.3% to 2.4 months for Condos and -14.3% to 2.4 months for 2-4 Units
2019 vs 2020, Change in Months of Inventory:
-32% to 1.7 months for Singles; -25% to 1.8 months for Condos and -8.3% to 2.2 months for 2-4 Units
- To view data for every Essex County town, go to: http://www.sullivanteam.com/Properties/Reports/Public/Charts.php
To dowload the full Housing Report go to: http://sullivanteam.com/pages/EssexCountyHousingReports