





Housing Report, July vs June 2026: National vs Essex County, MA 8/22/2026
National Housing Report (Homes and Condos): Prices and Unit Sales Fell
Unit sales fell -1.7% to 4.06 Million, median sale prices fell 1.5% to $434,100, Days On Market rose from 53 to 57. Active Listings rose +2.1% to 1.126 Million, Months of Inventory unchanged at 4.6 Months and 20% of Active Listings had price reductions. Homes sold for 99.1% of Asking Price.
National Bottom Line:
South and West continue to shift to buyer favorable markets as inventory surges with new-home construction. However, the Northeast and Midwest remain highly competitive due to low inventory as new construction lags and buyers are attracted to lower priced inland markets as mortgage interest rates remain elevated.
Essex County MA: July 2026 vs June 2026- Summer Cooldown, Elevated Interest rates!
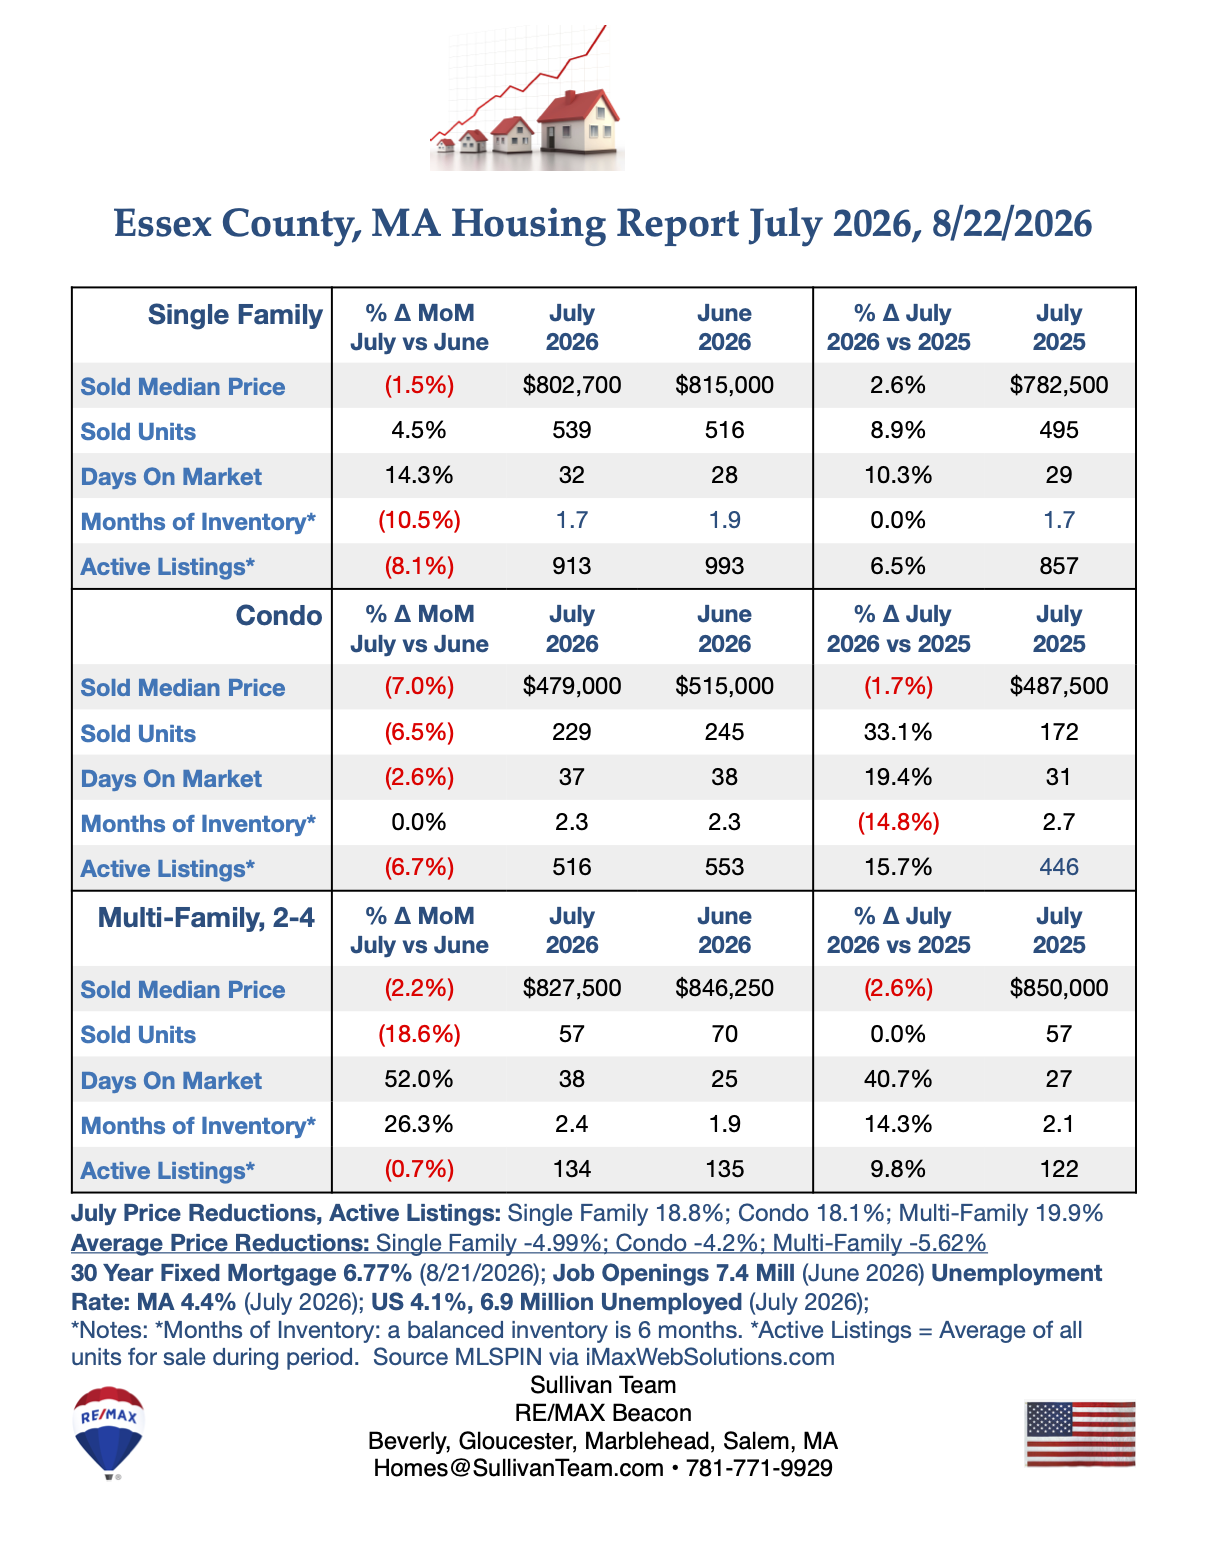
Month over month unit sales were mixed: Single Family up +4.5% to 539, Condos down -6.5% to 229 and 2-4 Multi-Families down -18.6% to 57. Median Sales Prices are down: Single Family -1.5% to $802,700, Condos -7.0% to $479,000 and Multi-Family -2.2% to $827,500. Days on Market were 32 for Single Family, 37 for Condos and 38 for Multi-Family.
Essex County MA: Median Sold Price to Median List Price Ratio - July 2026:
Single Family Sold for 100%; Condo Sold for 93.0%; Multi-Family Sold for 94.8%.
Active Listings With Price Reductions - June 2026:
18.8% of Single-Family, 18.1% of Condos and 19.9% of 2-4 Unit Multi-Family had price reductions. The average Price Reductions were: Single-Family -4.99%; Condo -4.2%; Multi-Family -5.62%.
Current Months of Inventory - a balanced market has 6 months of inventory:
Single-Family 1.7 months, Condo 2.3 months, 2-4 Unit Multi-Family 2.4 months.
Bottom line: Current low inventory favors sellers who price their properties correctly.
- To view data for every Essex County town, http://www.sullivanteam.com/Properties/Reports/Public/Charts.php
- To Download the full housing report go to: http://sullivanteam.com/pages/EssexCountyHousingReports